
Costco Analysis Scorecard: HOLD at $963 (4/5 Stars

Hey [name],
Quick question: When you research a company, do you ever think...
“I wish someone would just show me how they actually think through
financial analysis, moat evaluation, and valuation - not just
explain the concepts in theory?”
I created something to do exactly that.
It’s a one-page company scorecard format. Here’s what it includes:
━━━━━━━━━━━━━━━━━━━━━━━━━━━━━━━━━━━━━━━━━━━━━━━━━━━
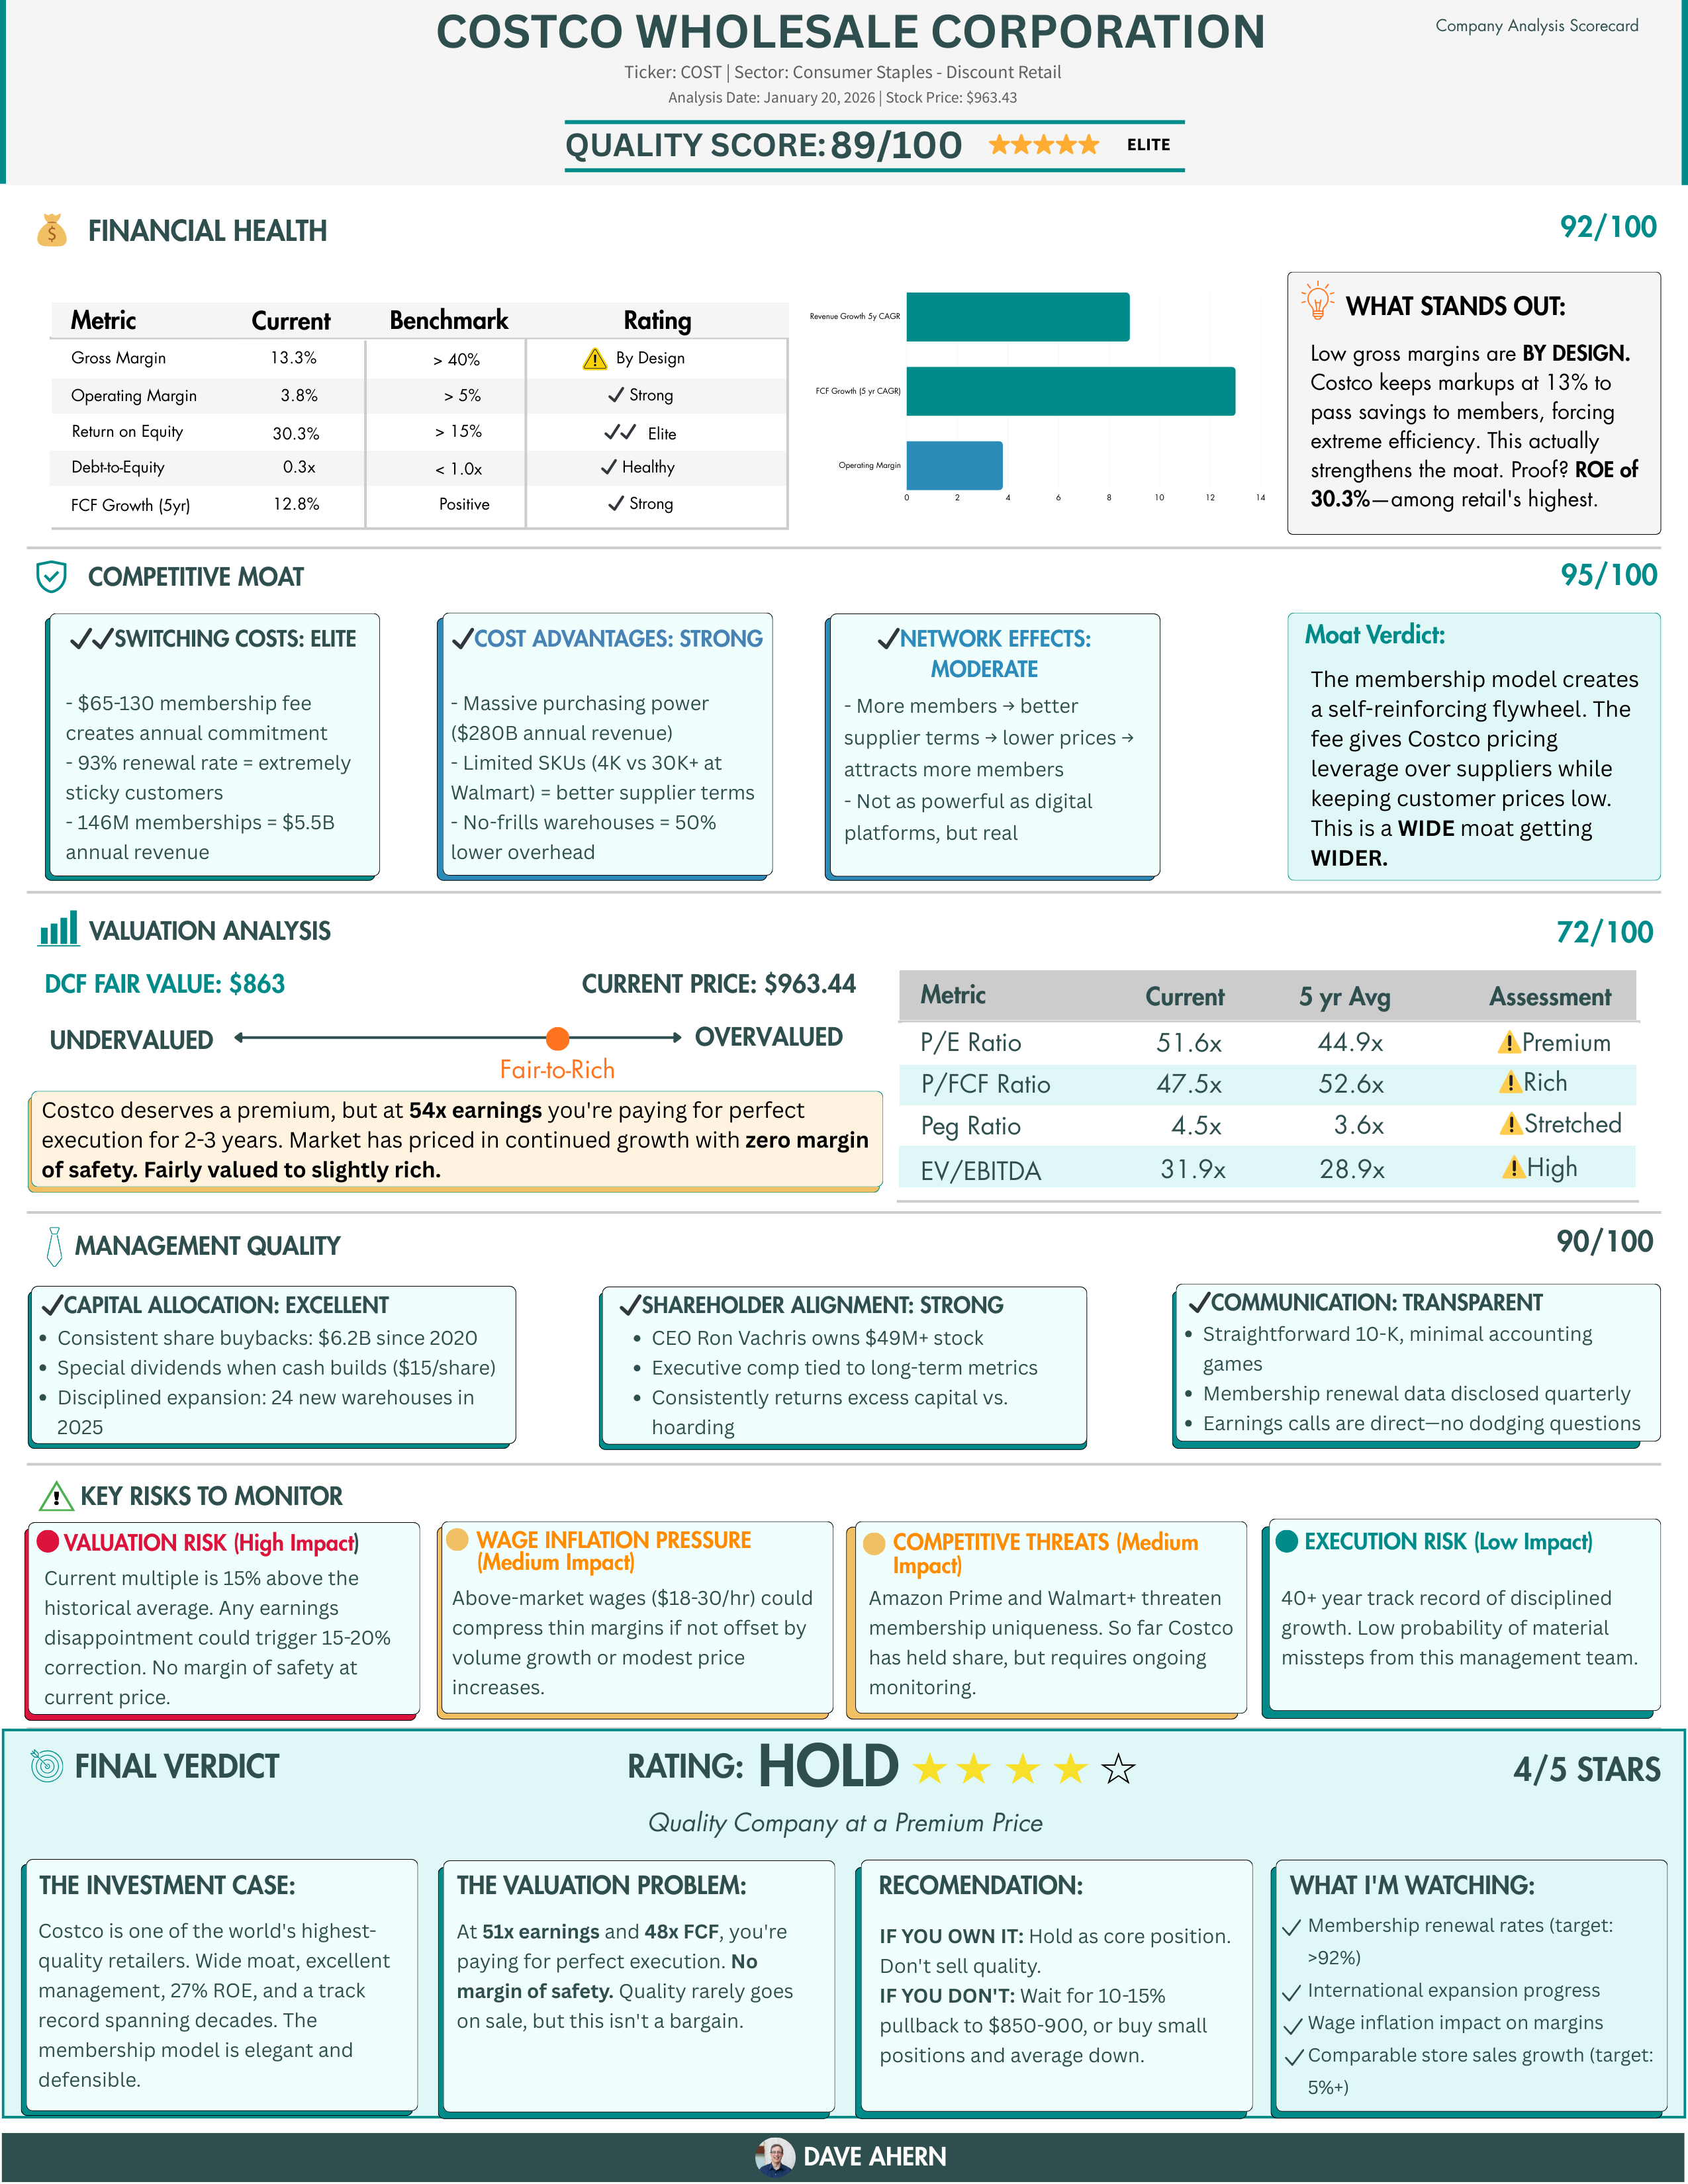
1. FINANCIAL HEALTH
The key metrics that matter, with the “why” behind the numbers.
For Costco: You’ll see why their 11% gross margin is BY DESIGN
(not a weakness), and why 30.3% ROE proves the membership model
works brilliantly.
━━━━━━━━━━━━━━━━━━━━━━━━━━━━━━━━━━━━━━━━━━━━━━━━━━━
2. COMPETITIVE MOAT
What protects this business? Rated Elite/Strong/Moderate/Weak.
Costco scores 95/100 with Elite switching costs (93% renewal rate),
Strong cost advantages (bulk purchasing power), and a self-reinforcing
membership flywheel.
━━━━━━━━━━━━━━━━━━━━━━━━━━━━━━━━━━━━━━━━━━━━━━━━━━━
3. VALUATION ANALYSIS
Is it cheap, fair, or expensive? The visual spectrum shows you
instantly.
Costco: Fair-to-Rich at $963. My DCF estimate: $863. Trading at
54x earnings with no margin of safety. Quality company, but not
a bargain.
━━━━━━━━━━━━━━━━━━━━━━━━━━━━━━━━━━━━━━━━━━━━━━━━━━━
4. MANAGEMENT QUALITY
Capital allocation, shareholder alignment, communication transparency.
Costco: 90/100. CEO owns $49M+ stock (started as forklift driver),
consistent buybacks, disciplined expansion. No financial games.
━━━━━━━━━━━━━━━━━━━━━━━━━━━━━━━━━━━━━━━━━━━━━━━━━━━
5. KEY RISKS
Color-coded by severity so you can triage instantly:
🔴 High: Valuation risk (45% above historical average)
🟡 Medium: Wage inflation, competitive threats
🟢 Low: Execution risk (pristine track record)
━━━━━━━━━━━━━━━━━━━━━━━━━━━━━━━━━━━━━━━━━━━━━━━━━━━
6. FINAL VERDICT
My bottom line: HOLD (4/5 stars)
Quality company at a premium price.
IF YOU OWN IT: Hold as core position.
IF YOU DON’T: Wait for 10-15% pullback to $850-900.
Plus specific metrics I’m monitoring going forward.
━━━━━━━━━━━━━━━━━━━━━━━━━━━━━━━━━━━━━━━━━━━━━━━━━━━
HERE’S THE COMPLETE SCORECARD:
━━━━━━━━━━━━━━━━━━━━━━━━━━━━━━━━━━━━━━━━━━━━━━━━━━━
WHY I BUILT THIS:
For years I’ve taught frameworks through infographics. But I
realized I never showed you what it looks like when I actually
APPLY those frameworks to a real company.
This scorecard format is theory + practice in one page.
You can:
Scan it in 60 seconds (just read the scores + verdict)
Deep-dive for 10 minutes (read every section thoroughly)
Save it as permanent reference (revisit during earnings)
Use it as a template (apply same framework to your research)
━━━━━━━━━━━━━━━━━━━━━━━━━━━━━━━━━━━━━━━━━━━━━━━━━━━
Is this format helpful? Would you want to see these regularly?
Hit reply and let me know:
- More useful than separate articles?
- What would make it even better?
- What companies should I analyze next?
Your input will determine if I keep doing these.
Thanks,
Dave
P.S. - Already planning TSMC (semiconductors) and Adyen (fintech)
if this lands well. Let me know what you think.