
Valuation Multiples That Map to Cash: Understanding EV/EBIT and EV/FCF

When evaluating semiconductor companies, many investors default to the Price-to-Earnings (P/E) ratio as their go-to valuation metric. But what if I told you that P/E ratios can actually mislead you when comparing companies with different capital structures?
Think about this: two semiconductor companies generate identical operating profits, but one carries significant debt while the other sits on a mountain of cash. Their P/E ratios will look vastly different, making direct comparison nearly impossible. This is where enterprise value-based multiples shine.
In today’s post, we will learn:
Okay, let’s dive in and learn more about how these enterprise value multiples can help you make better investment decisions.
What is Enterprise Value?
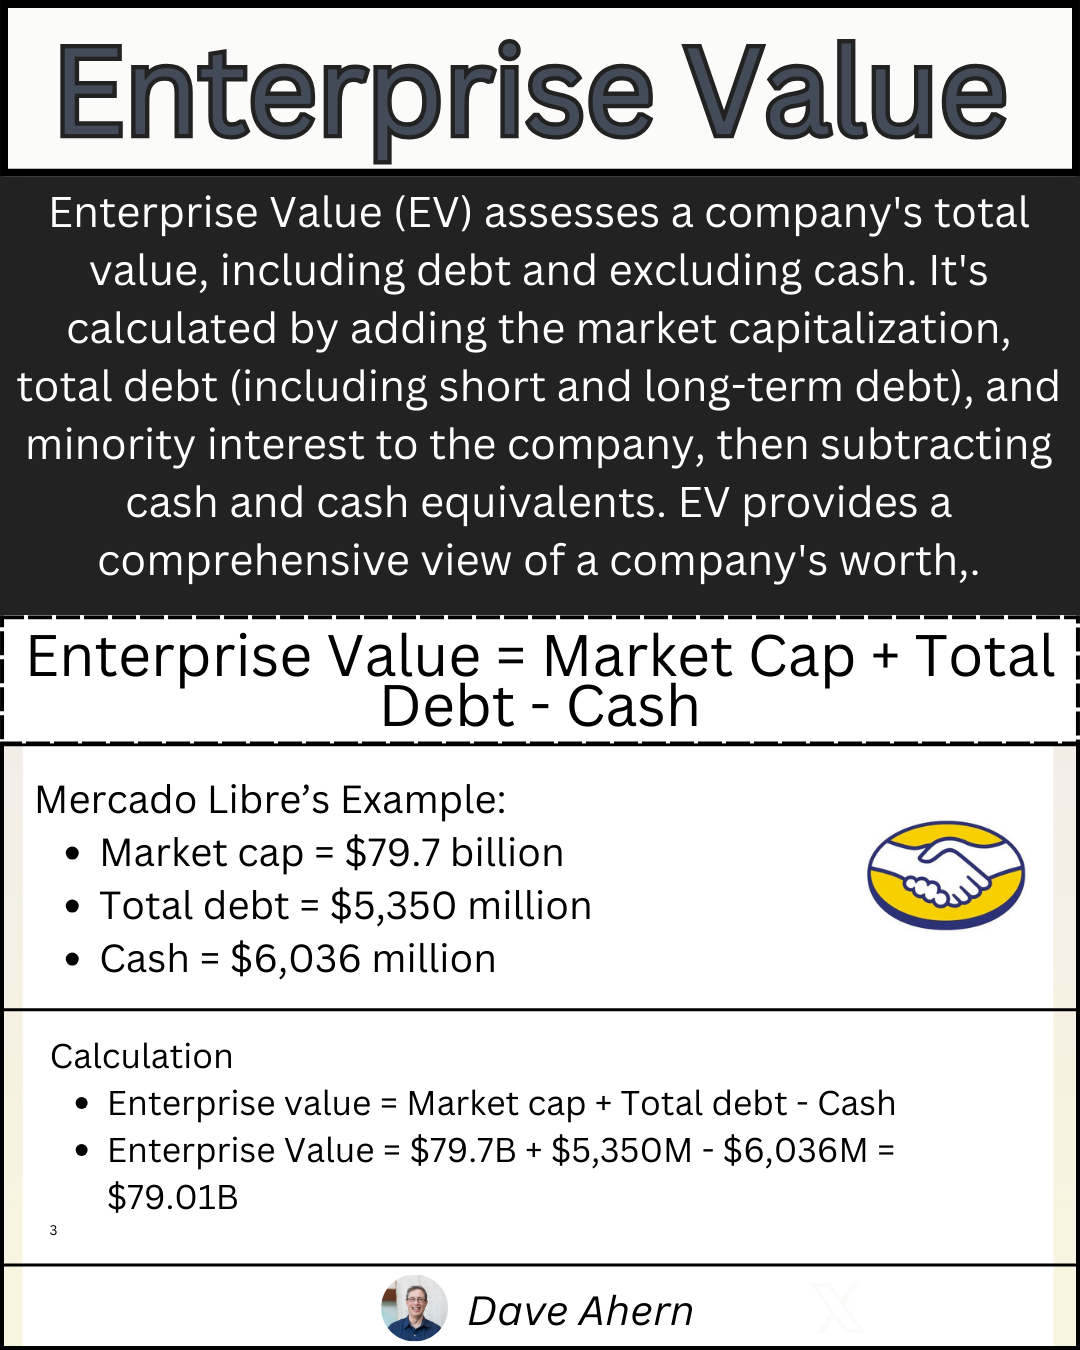
Before we can discuss EV/EBIT and EV/FCF, we need to understand what Enterprise Value actually represents. According to Investopedia, Enterprise Value is “a measure of a company’s total value, often used as a more comprehensive alternative to equity market capitalization.”
Think of it this way: if you wanted to buy a company outright, you’d need to pay for all the equity (the market capitalization), take on all the company’s debt, but you’d also get to pocket all the cash sitting on the balance sheet. That’s Enterprise Value in a nutshell.
The formula looks like this:
Enterprise Value = Market Capitalization + Total Debt - Cash and Cash Equivalents
Where:
Market Capitalization = Current Stock Price × Shares Outstanding
Total Debt = Short-term Debt + Long-term Debt
Cash and Cash Equivalents = Cash + Marketable Securities
I know it looks scary, but we will walk through each step with real companies, and you’ll see that it remains quite straightforward.
Now that we understand Enterprise Value, let’s discuss why it matters more than market cap when comparing companies.
Why Enterprise Value Matters
Here’s where Enterprise Value becomes powerful: it allows us to compare companies as if they all had the same capital structure. This is incredibly important in the semiconductor industry, where business models vary dramatically.
Consider two companies:
Company A (Fabless): No manufacturing facilities, minimal debt, $10 billion in cash
Company B (Integrated): Owns foundries, $8 billion in debt, minimal cash
If both companies have the same market cap, their P/E ratios will differ significantly because interest payments on that debt reduce Company B’s earnings. But their Enterprise Values indicate what it would actually cost to acquire their operating businesses, which remains a much fairer comparison.
The beauty of EV-based multiples is that they strip away financing decisions and focus on underlying business performance. Remember, capital structure remains a choice management makes, but it doesn’t change how good the business actually is at generating profits or cash.
Understanding EV/EBIT: The Operating Efficiency Multiple
What is EBIT?
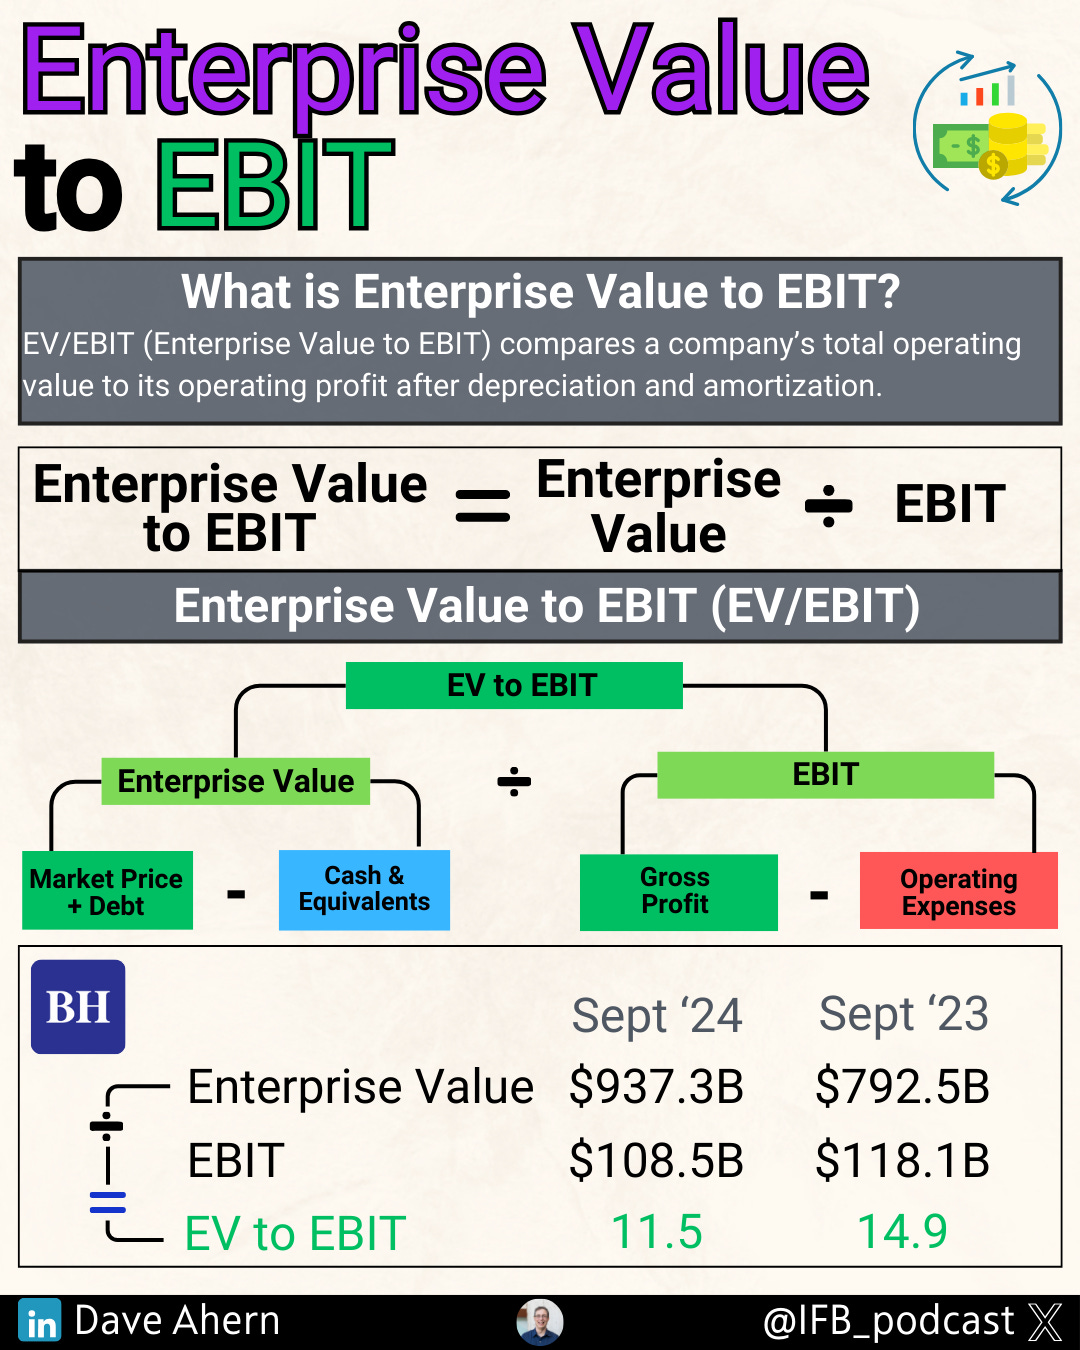
EBIT stands for Earnings Before Interest and Taxes, though you’ll often see it called “Operating Income” on financial statements. This metric shows us how profitable a company’s core operations remain, before accounting for how the business is financed (interest) or where it’s located (taxes).
The formula for the EV/EBIT multiple is as follows:
EV/EBIT = Enterprise Value ÷ EBIT
Where:
Enterprise Value = Market Cap + Debt - Cash
EBIT = Operating Income (found on the Income Statement)
Why EV/EBIT Works Well for Semiconductors
The semiconductor industry is capital-intensive and characterized by diverse business models. Some companies (like NVIDIA and AMD) are “fabless” - they design chips but outsource all manufacturing. Others (like Intel) own expensive fabrication facilities. Still others (like Taiwan Semiconductor) are pure-play foundries.
These different models require different levels of debt financing. EV/EBIT lets us compare them fairly because it measures how efficiently each company generates operating profit, regardless of how it finances its operations.
Not too hard, was it? The concept remains simple: you’re assessing how much enterprise value investors pay for each dollar of operating profit.
Understanding EV/FCF: The Cash Generation Multiple
What is Free Cash Flow?
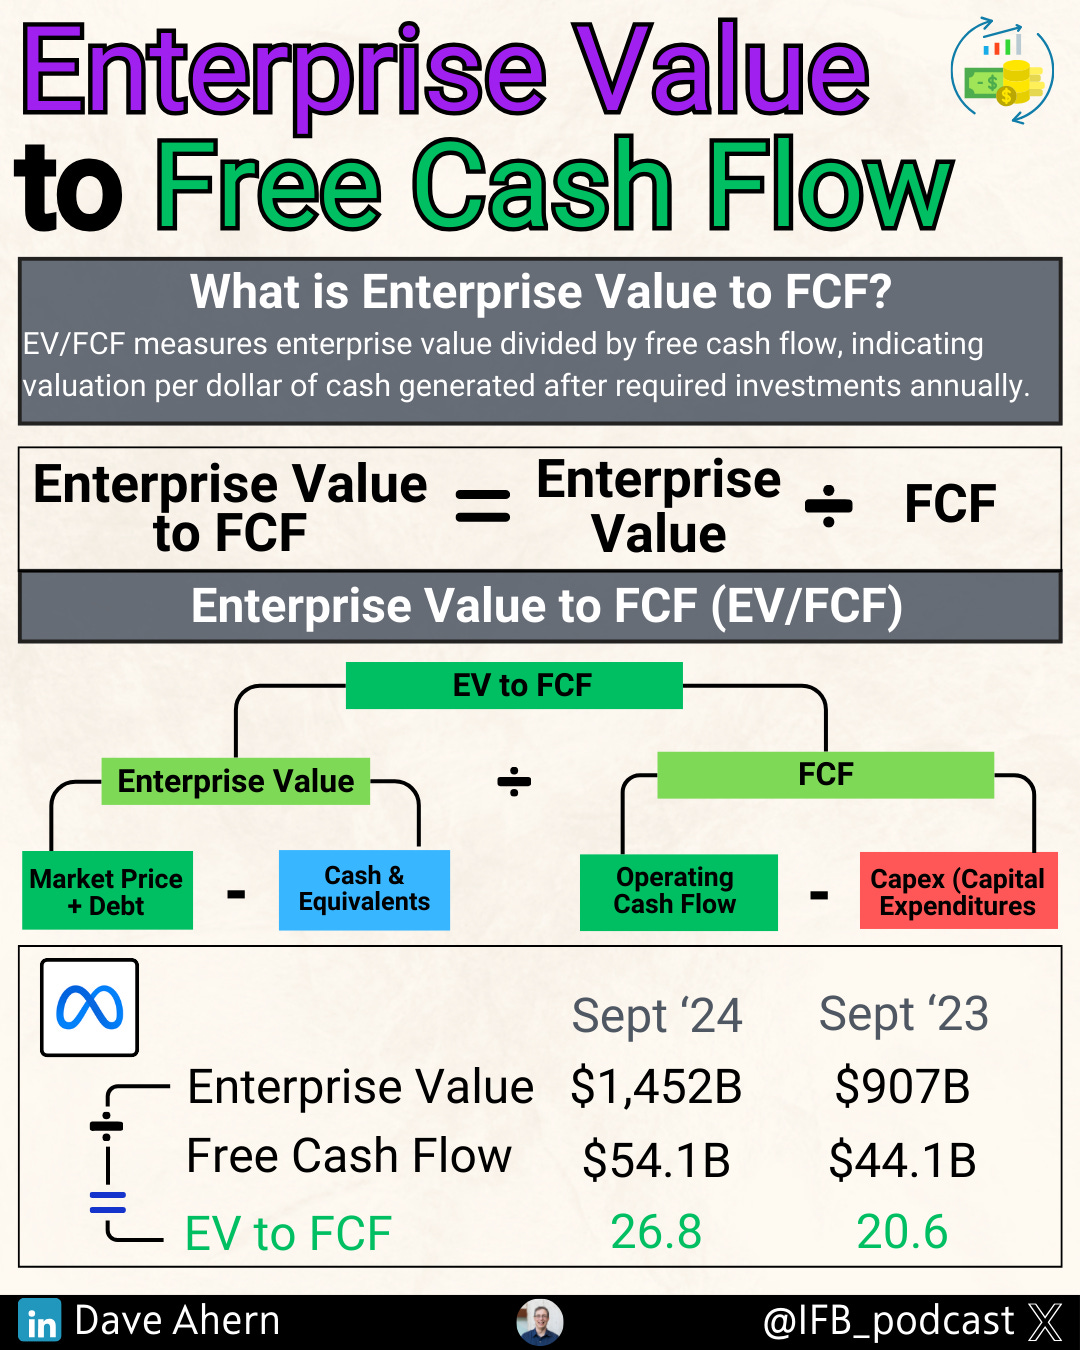
Free Cash Flow is the cash a business generates after paying for all capital expenditures required to maintain and grow operations. This is real money that could be returned to shareholders or used for acquisitions.
The formula looks like this:
Free Cash Flow = Operating Cash Flow - Capital Expenditures
Where:
Operating Cash Flow = Cash from Operations (found on Cash Flow Statement)
Capital Expenditures = CapEx (also on Cash Flow Statement)
The EV/FCF multiple formula is:
EV/FCF = Enterprise Value ÷ Free Cash Flow
Why EV/FCF Reveals Different Insights
Here’s where things get interesting: a company can have great EBIT but terrible FCF if it requires massive ongoing capital investments. This happens frequently in the semiconductor industry.
Imagine a foundry company that generates $5 billion in EBIT but must spend $4 billion annually on new equipment and facilities to remain competitive. Its Free Cash Flow would only be $1 billion (assuming $5 billion in operating cash flow). Suddenly, that company looks far more expensive on an EV/FCF basis than on an EV/EBIT basis.
This distinction matters enormously when evaluating which companies can return cash to shareholders versus which must continually reinvest to survive.
When to Use EV/EBIT vs. EV/FCF
Now that we understand both metrics, let’s discuss when each one remains most useful.
Use EV/EBIT When:
Comparing operating efficiency across different business models
Analyzing mature companies with relatively stable CapEx requirements
Evaluating companies in CapEx-heavy industries where everyone needs massive investments
Making quick comparisons (EBIT is easier to find than FCF calculations)
Use EV/FCF When:
Assessing actual cash generation available to shareholders
Comparing companies with vastly different CapEx needs
Evaluating growth companies that might be investing heavily now for future returns
Determining dividend sustainability or share buyback capacity
The key insight remains: EV/EBIT reflects profitability, while EV/FCF reflects cash generation. Sometimes these metrics tell the same story; sometimes they diverge dramatically. When they diverge, that’s when you need to dig deeper.
Semiconductor Industry Analysis
Okay, let’s put this into practice with real companies from the semiconductor industry. We’ll use five companies that represent different business models:
NVIDIA (NVDA) - Fabless, AI/GPU leader
Intel (INTC) - Integrated manufacturer, struggling turnaround
Taiwan Semiconductor (TSM) - Pure-play foundry
AMD - Fabless, NVIDIA competitor
Broadcom (AVGO) - Diversified, acquisition-heavy
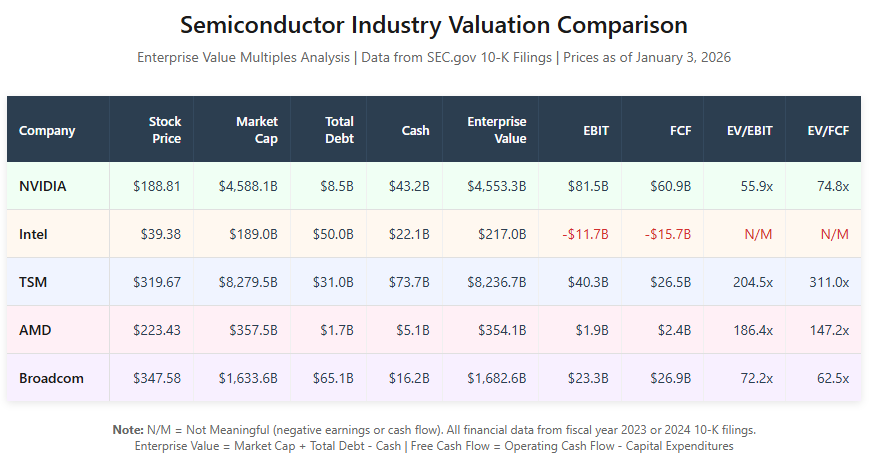
Using data from each company’s most recent 10-K filing on SEC.gov and current stock prices as of January 3, 2026, here’s what we find:
Comprehensive Comparison Table
Now that we have real numbers, let’s walk through what they tell us.
NVIDIA: The Efficient Cash Machine
Let’s start with NVIDIA as our first example. With a stock price of $188.81 and 24.3 billion shares outstanding, NVIDIA’s market capitalization remains:
Market Cap = $188.81 × 24.3 billion = $4,588.1 billion
Now we calculate Enterprise Value. NVIDIA carries $8.5 billion in total debt but holds a massive $43.2 billion in cash:
Enterprise Value = $4,588.1B + $8.5B - $43.2B = $4,553.3 billion
Notice that NVIDIA’s Enterprise Value is actually lower than its market cap because it holds more cash than debt. This is typical of highly profitable, cash-generative businesses.
For fiscal year 2024, NVIDIA generated $81.5 billion in operating income (EBIT). This gives us:
EV/EBIT = $4,553.3B ÷ $81.5B = 55.9x
This means investors pay $55.90 of enterprise value for every dollar of operating profit. That’s a premium valuation, but remember - NVIDIA is dominating the AI chip market with exceptional growth.
Now let’s calculate Free Cash Flow. NVIDIA generated $64.1 billion in operating cash flow and spent only $3.2 billion on capital expenditures:
Free Cash Flow = $64.1B - $3.2B = $60.9 billion
EV/FCF = $4,553.3B ÷ $60.9B = 74.8x
Here’s where it gets interesting: NVIDIA’s EV/FCF (74.8x) is higher than its EV/EBIT (55.9x) by about 19 points. Wait - didn’t we say that a narrow gap indicates a capital-light business? We did, but there’s a catch.
The gap exists because NVIDIA’s operating income ($81.5B) is significantly higher than its free cash flow ($60.9B), even though its CapEx remains minimal. This happens because of working capital changes and non-cash charges. The key insight remains that NVIDIA’s CapEx of only $3.2 billion represents just 5% of operating cash flow - that’s incredibly capital-light for a semiconductor company.
Intel: The Turnaround Challenge
Let’s look at Intel next - and this is where things get sobering.
Market Cap = $39.38 × 4.8 billion = $189.0 billion
Intel carries significant debt from its fab investments:
Enterprise Value = $189.0B + $50.0B - $22.1B = $217.0 billion
Here’s the problem: Intel reported negative operating income of -$11.7 billion for fiscal 2023. That’s right - the company lost money at the operating level.
When EBIT is negative, the EV/EBIT multiple becomes meaningless. You can’t value a company on losses using this metric.
Even worse, Intel’s free cash flow tells an even more dire story:
Free Cash Flow = $8.3B - $23.9B = -$15.7 billion
Intel burned through $15.7 billion in cash after capital expenditures. The company generated $8.3 billion from operations but had to invest $23.9 billion in new fabs and equipment - nearly 3x its operating cash flow.
This is what a struggling, capital-intensive turnaround looks like. Intel must invest heavily in manufacturing to stay competitive, but those investments are coming at a time when the company isn’t profitable. The EV/FCF multiple is also meaningless here.
This example shows exactly why we need these metrics - Intel’s situation would be impossible to understand from P/E ratios alone.
Taiwan Semiconductor: The CapEx Burden
TSM operates the world’s most advanced foundries, and the numbers show the burden of maintaining that leadership:
Market Cap = $319.67 × 25.9 billion = $8,279.5 billion
Enterprise Value = $8,279.5B + $31.0B - $73.7B = $8,236.7 billion
TSM’s operating income for the year was $40.3 billion:
EV/EBIT = $8,236.7B ÷ $40.3B = 204.5x
Now watch what happens when we look at free cash flow:
Free Cash Flow = $55.6B - $29.1B = $26.5 billion
EV/FCF = $8,236.7B ÷ $26.5B = 311.0x
The gap between EV/EBIT (204.5x) and EV/FCF (311.0x) is massive - 106 points. This gap tells the story of TSM’s business model. The company must invest $29.1 billion annually in new equipment just to stay at the leading edge. That’s 52% of operating cash flow going right back into CapEx.
This is the foundry model in action: exceptional operating margins but enormous capital requirements. TSM can’t reduce this CapEx without falling behind technologically.
AMD: Growth at a Premium
AMD presents an interesting contrast to NVIDIA:
Market Cap = $223.43 × 1.6 billion = $357.5 billion
Enterprise Value = $357.5B + $1.7B - $5.1B = $354.1 billion
AMD generated $1.9 billion in operating income:
EV/EBIT = $354.1B ÷ $1.9B = 186.4x
And free cash flow of $2.4 billion:
EV/FCF = $354.1B ÷ $2.4B = 147.2x
These multiples are significantly higher than NVIDIA’s, despite AMD also being fabless. Why? The market is pricing AMD based on growth expectations, but the company’s current profitability remains much lower than NVIDIA’s. AMD generated $1.9B in EBIT versus NVIDIA’s $81.5B - that’s a 43x difference in absolute profit despite AMD’s market cap being only 13x smaller.
The gap between EV/EBIT (186.4x) and EV/FCF (147.2x) is 39 points - inverted from what we’d normally expect. This happens because AMD’s FCF ($2.4B) is actually higher than its operating income ($1.9B) after backing out non-cash charges and working capital. The CapEx of only $636 million represents just 21% of operating cash flow - very capital-light.
Broadcom: The Diversified Player
Finally, let’s examine Broadcom:
Market Cap = $347.58 × 4.7 billion = $1,633.6 billion
Broadcom carries significant debt from acquisitions:
Enterprise Value = $1,633.6B + $65.1B - $16.2B = $1,682.6 billion
Operating income was $23.3 billion:
EV/EBIT = $1,682.6B ÷ $23.3B = 72.2x
Free cash flow was $26.9 billion:
EV/FCF = $1,682.6B ÷ $26.9B = 62.5x
Broadcom’s EV/FCF (62.5x) is actually lower than its EV/EBIT (72.2x) by about 10 points. This inverted pattern shows that Broadcom’s business model - combining semiconductors with software - is relatively capital-light, spending only $623 million in CapEx against $27.5 billion in operating cash flow.
The company’s high debt load ($65.1B) from acquisitions increases its Enterprise Value, but the business generates exceptional cash flow to service that debt.
What This Comparison Reveals
Looking across all five companies, we see dramatically different business models:
Capital-Light Winners (NVIDIA, AMD, Broadcom): Minimal CapEx as percentage of operating cash flow, allowing strong FCF generation. Trading at premiums due to efficiency and growth.
Capital-Intensive Models (TSM): Must reinvest heavily to maintain technological leadership. The 106-point gap between EV/EBIT and EV/FCF shows the CapEx burden clearly.
Turnaround Situations (Intel): Negative profitability makes EV multiples meaningless, highlighting why you can’t rely on a single metric. The negative FCF shows the company is consuming cash while trying to rebuild.
The absolute multiples also tell us about market expectations. TSM trades at 204.5x EV/EBIT despite being profitable because investors worry about competition and the commodity nature of foundry services. AMD trades at 186.4x despite lower absolute profits because the market expects massive growth in AI and data center chips.
Not too hard, was it? Real numbers from actual 10-Ks bring these concepts to life far better than theoretical examples ever could.
Quick note before we continue:
Everything up to this point is free because I believe understanding valuation concepts should be accessible to everyone. You now know what EV/EBIT and EV/FCF multiples measure, why they matter, and how real companies compare.
The sections that follow show you how to calculate these multiples yourself using SEC.gov filings. I walk through the complete process step by step using NVIDIA’s financial statements—where to find each number, how to perform the calculations, and how to interpret the results.
If you’re content understanding the concepts and reading other people’s analysis, the free content has given you that. If you want to conduct your own analysis and value companies independently, the paid content will teach you how.
No pressure either way. I just want you to know what’s ahead so you can decide if it’s worth it for you.
Let’s continue.
