
Understanding Free Cash Flow Conversion

Finding a company's true cash-generating ability remains one of the most important skills for any investor to master. Sure, companies report impressive net income numbers all the time, but how much of that profit actually turns into cold, hard cash that can be reinvested in the business, returned to shareholders, or used to pay down debt?
That’s where free cash flow conversion comes in.
I know it doesn't sound very easy, but it isn’t. Today, we’re going to demystify this crucial metric and show you exactly how to calculate it using real examples from two very different companies: Meta Platforms and Walmart.
In today’s post, we will learn:
What is Free Cash Flow Conversion?
Why Free Cash Flow Conversion Matters to Investors
How to Calculate Free Cash Flow Conversion
Example 1: Meta Platforms (META) - A Digital Advertising Giant
Example 2: Walmart (WMT) - A Retail Powerhouse
Comparing the Two Business Models
What Makes a Good Free Cash Flow Conversion Rate?
Limitations and Important Considerations
Investor Takeaway
Okay, let’s dive in and learn more about free cash flow conversion.
What is Free Cash Flow Conversion?
Before we jump into the calculations, let’s define what we’re talking about. According to Investopedia, free cash flow conversion measures “the ability of a company to convert its earnings into cash.” But let me break it down in simpler terms.
Think of it this way: Net income is like your salary on paper, but free cash flow is what actually hits your bank account after all the necessary expenses. A company might report $1 billion in net income. Still, if it needs to spend $800 million on new equipment to maintain its business, the actual cash available is much less impressive.
The free cash flow conversion rate shows the percentage of net income that translates into free cash flow. It’s a quality check on earnings - showing us whether those profits are real and spendable, or whether the ongoing needs of the business are consuming them.
Why Free Cash Flow Conversion Matters to Investors
You might wonder, “Why should I care about this when I can just look at net income?” Well, let me tell you why this metric remains crucial for investment analysis.
First, the free cash flow conversion rate reveals a business's capital intensity. Companies with high conversion rates can turn most of their profits into cash, while those with low rates need to reinvest to stay competitive. This directly affects how much money is available for dividends, share buybacks, or growth investments.
Second, it helps identify potential red flags. If a company consistently shows strong net income but weak free cash flow conversion, it might indicate aggressive accounting practices or a business model that requires constant heavy investment.
Third, and this is important for value investors, free cash flow remains the basis for most discounted cash flow (DCF) valuations. As Warren Buffett famously said, “Owner earnings” (his term for free cash flow) is what really matters when valuing a business.
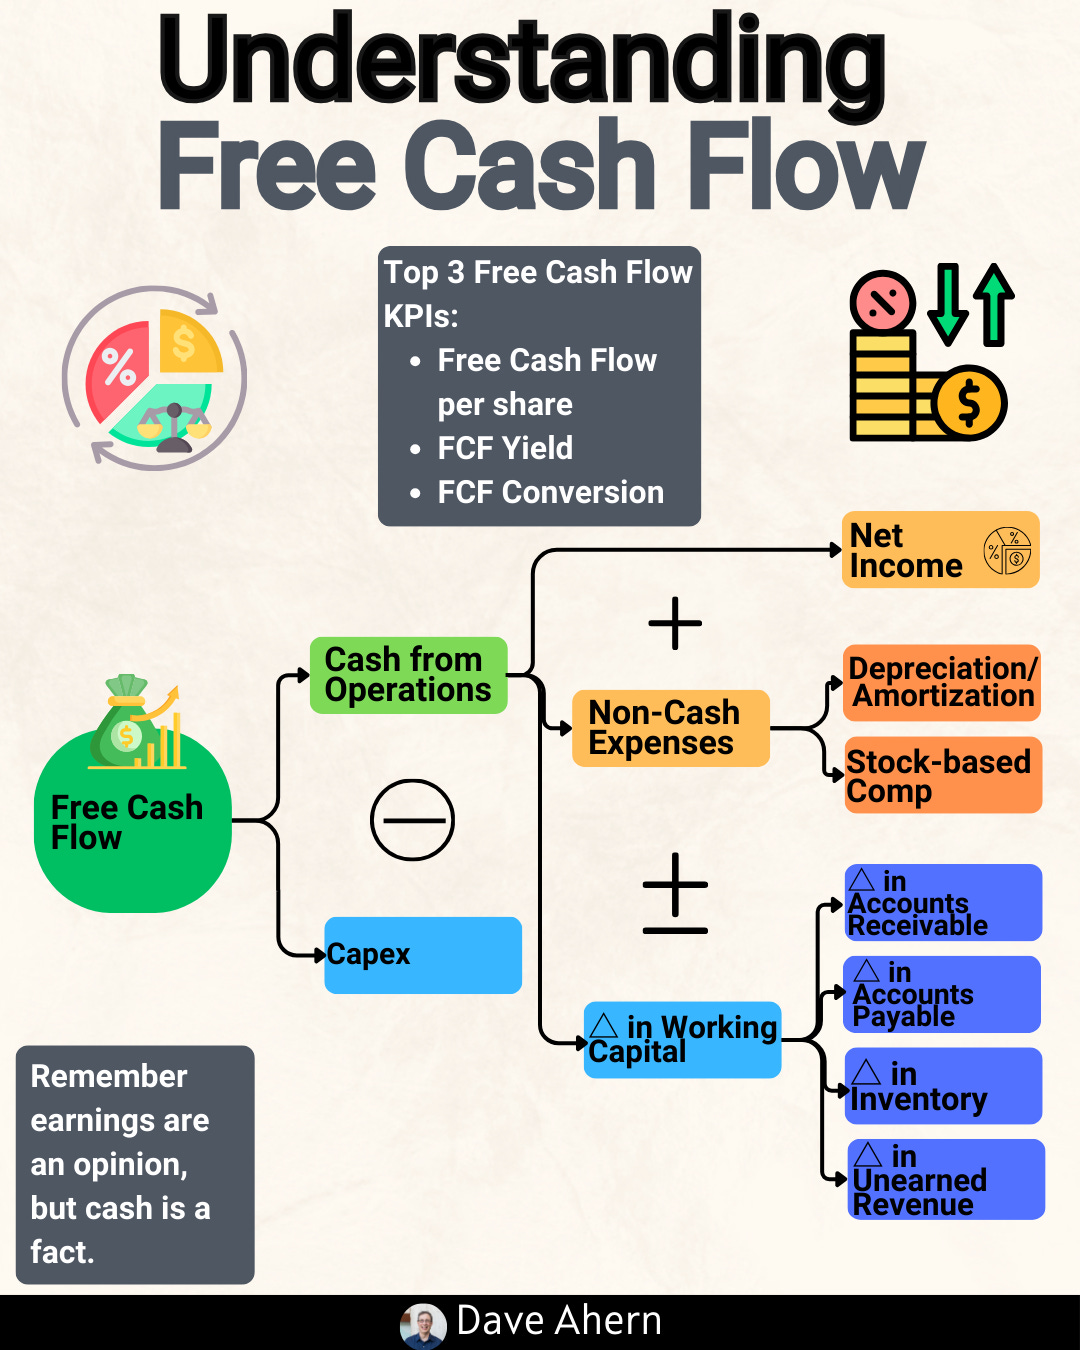
How to Calculate Free Cash Flow Conversion
Now let’s get into the mechanics. The formula looks like this:
Free Cash Flow Conversion Rate = (Free Cash Flow ÷ Net Income) × 100
Where:
Free Cash Flow = Operating Cash Flow - Capital Expenditures
Net Income = The bottom-line profit from the income statement
The result is expressed as a percentage
But here’s where it gets interesting - we need to find these numbers in the financial statements. Let me walk you through exactly where to look.
The first step is to locate the cash flow statement in the company’s 10-K or quarterly report. You’ll find “Net cash provided by operating activities” - that’s your operating cash flow.
The second step is to find capital expenditures. This is usually listed as “Purchases of property and equipment” or “Capital expenditures” in the investing activities section of the cash flow statement.
The third step is to find net income, which appears at the bottom of the income statement and usually at the top of the cash flow statement.
Example 1: Meta Platforms (META) - A Digital Advertising Giant
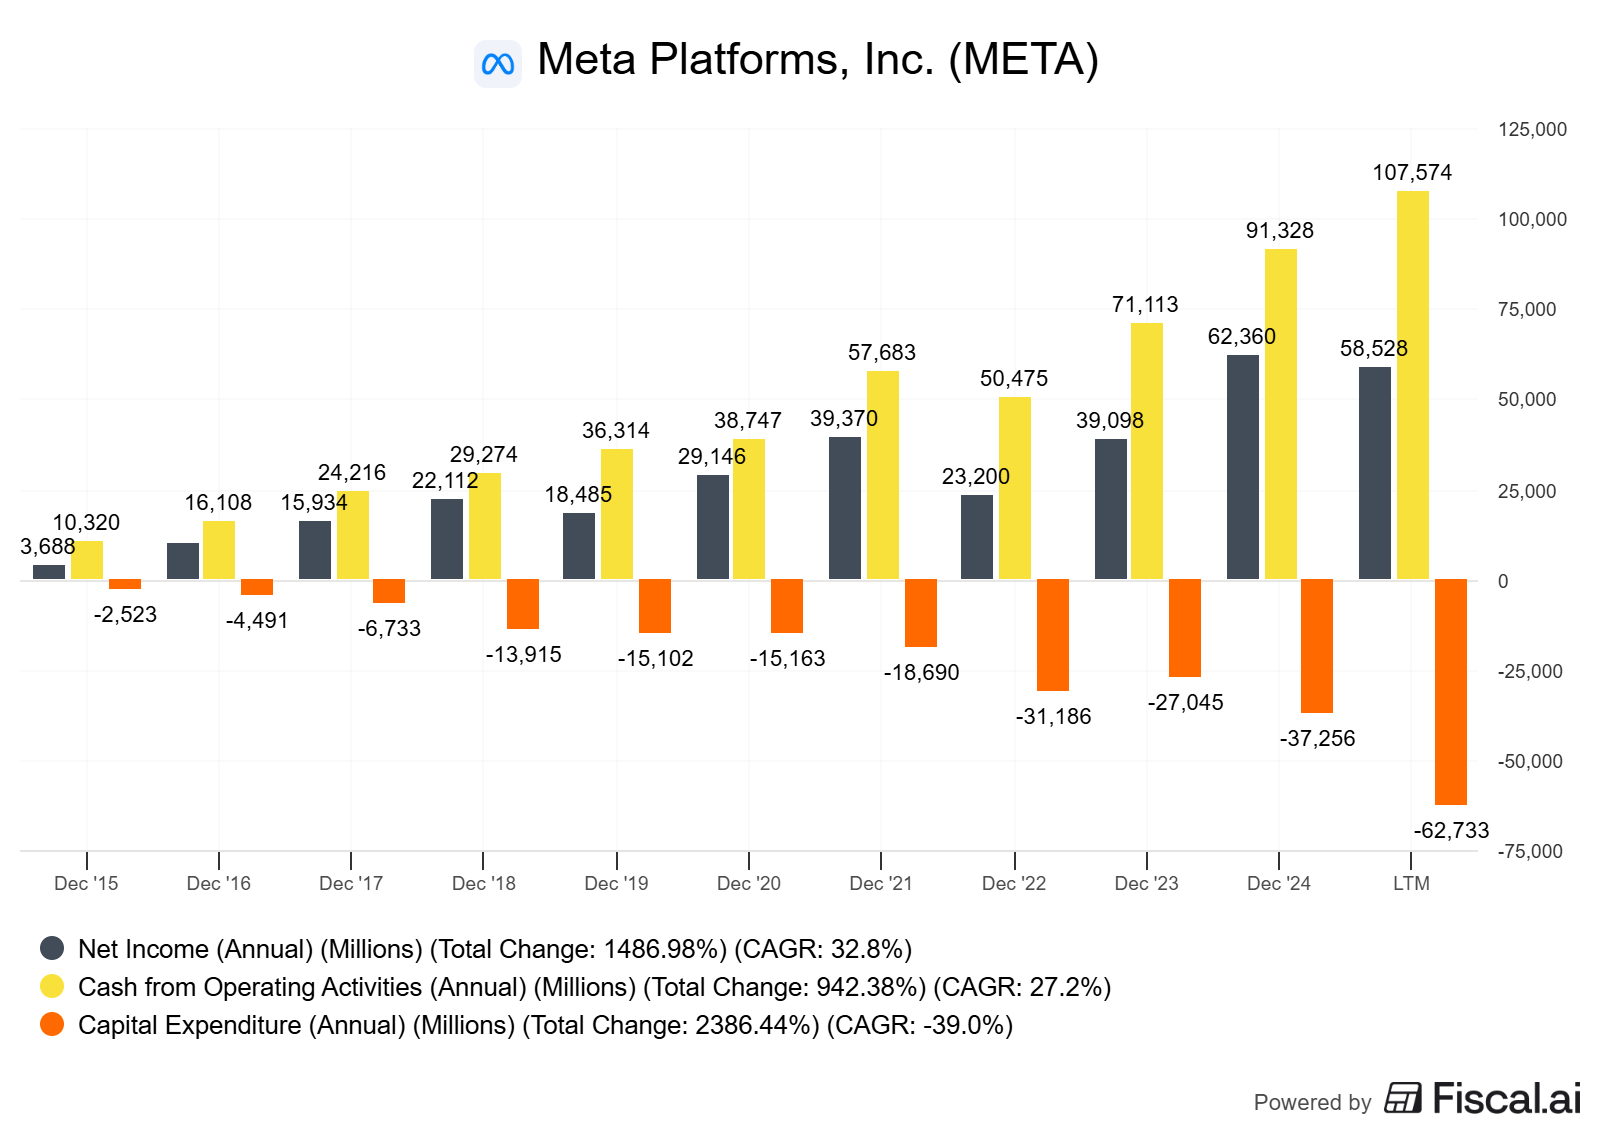
Let’s use Meta as our first guinea pig. Using their 2024 annual report filed with the SEC, here’s what we find:
For the fiscal year ended December 31, 2024:
Net Income: $62.36 billion
Operating Cash Flow: $91.33 billion
Capital Expenditures: $39.23 billion (including principal payments on finance leases)
Free Cash Flow: $52.10 billion
Now, let’s calculate the free cash flow conversion rate:
Free Cash Flow Conversion = ($52.10 billion ÷ $62.36 billion) × 100 = 83.5%
Wow! Meta converts 83.5% of its net income into free cash flow. That’s exceptional. What this tells us is that Meta’s business model - primarily digital advertising - requires relatively less capital reinvestment compared to its earnings. Once they’ve built their platforms and data centers, the incremental cost of serving more ads remains relatively low.
This high conversion rate means Meta has tremendous flexibility. They can return cash to shareholders through buybacks (which they did to the tune of $29.75 billion in 2024), invest in new ventures like the metaverse, or build a war chest for future opportunities.
One caveat here, as Meta tries to keep pace in the AI race, we need to keep an eye on the free cash flow and the conversion rate as I suspect it will continue to trend downwards.
Example 2: Walmart (WMT) - A Retail Powerhouse
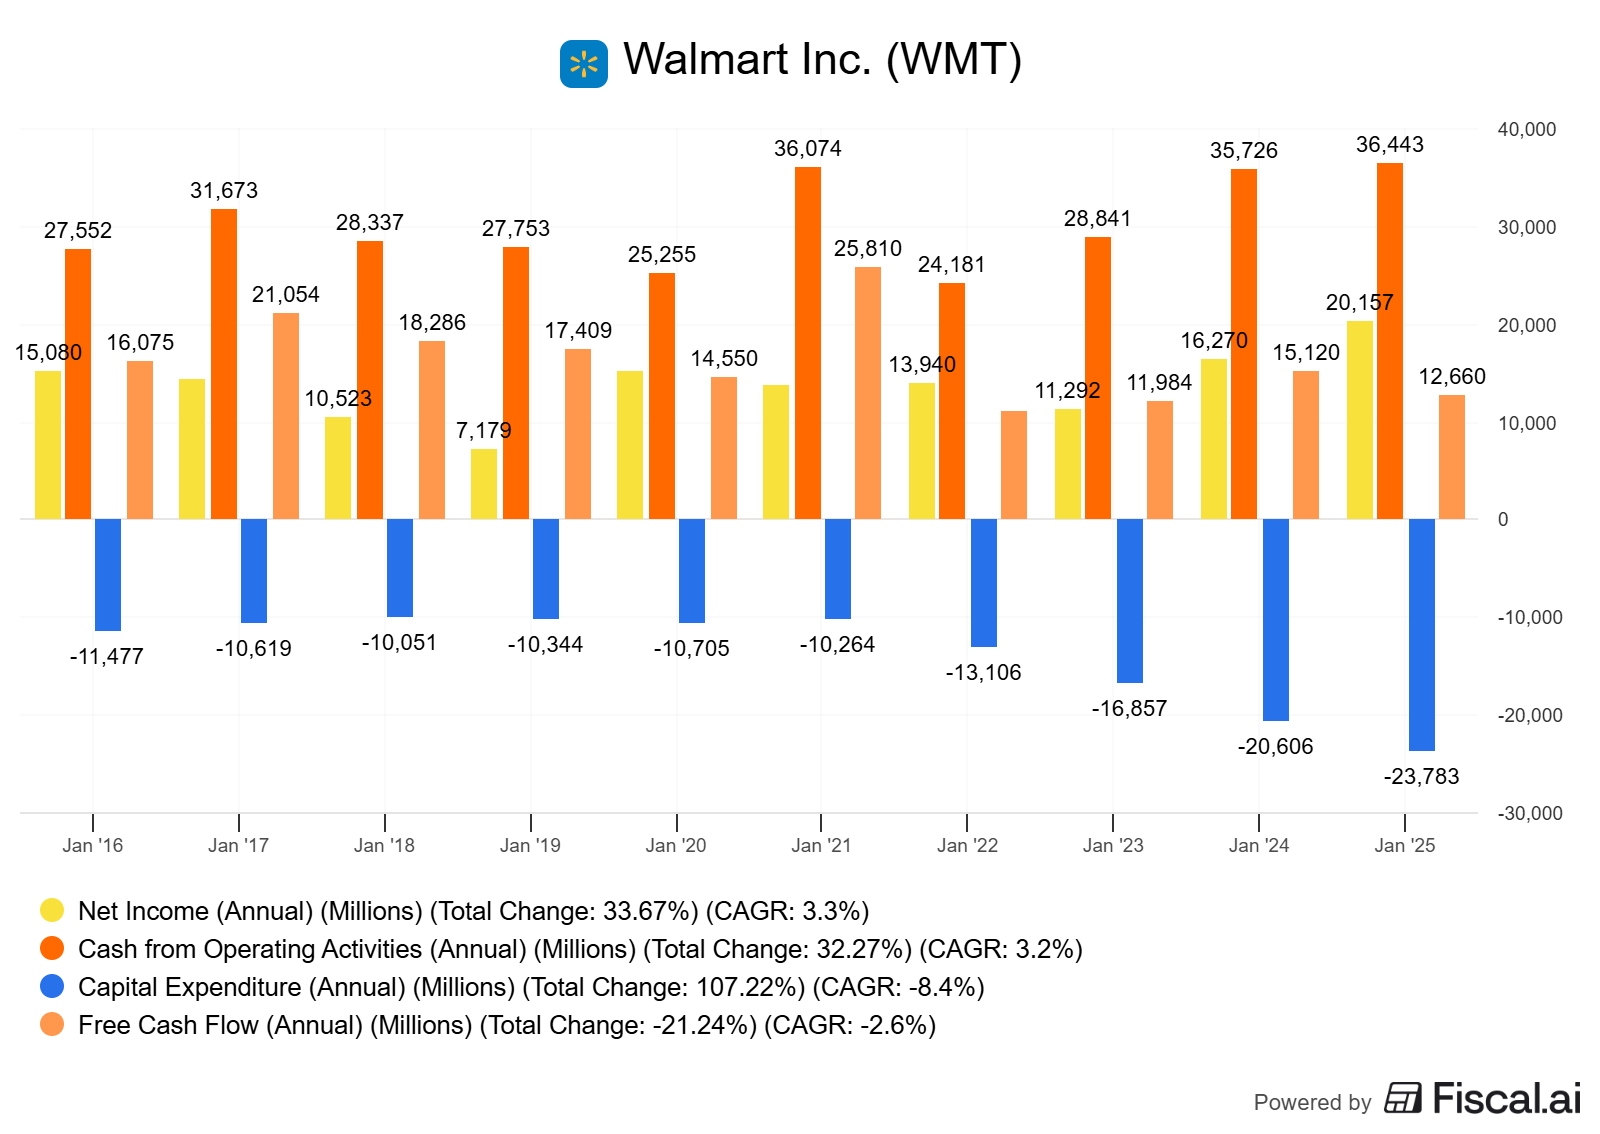
Let’s try another company from a completely different industry. Using Walmart’s fiscal 2025 annual report (year ended January 31, 2025), we find:
For the fiscal year ended January 31, 2025:
Net Income: $20.2 billion
Operating Cash Flow: $36.4 billion
Capital Expenditures: $23.8 billion
Free Cash Flow: $12.7 billion
Let’s calculate Walmart’s free cash flow conversion:
Free Cash Flow Conversion = ($12.7 billion ÷ $20.2 billion) × 100 = 62.9%
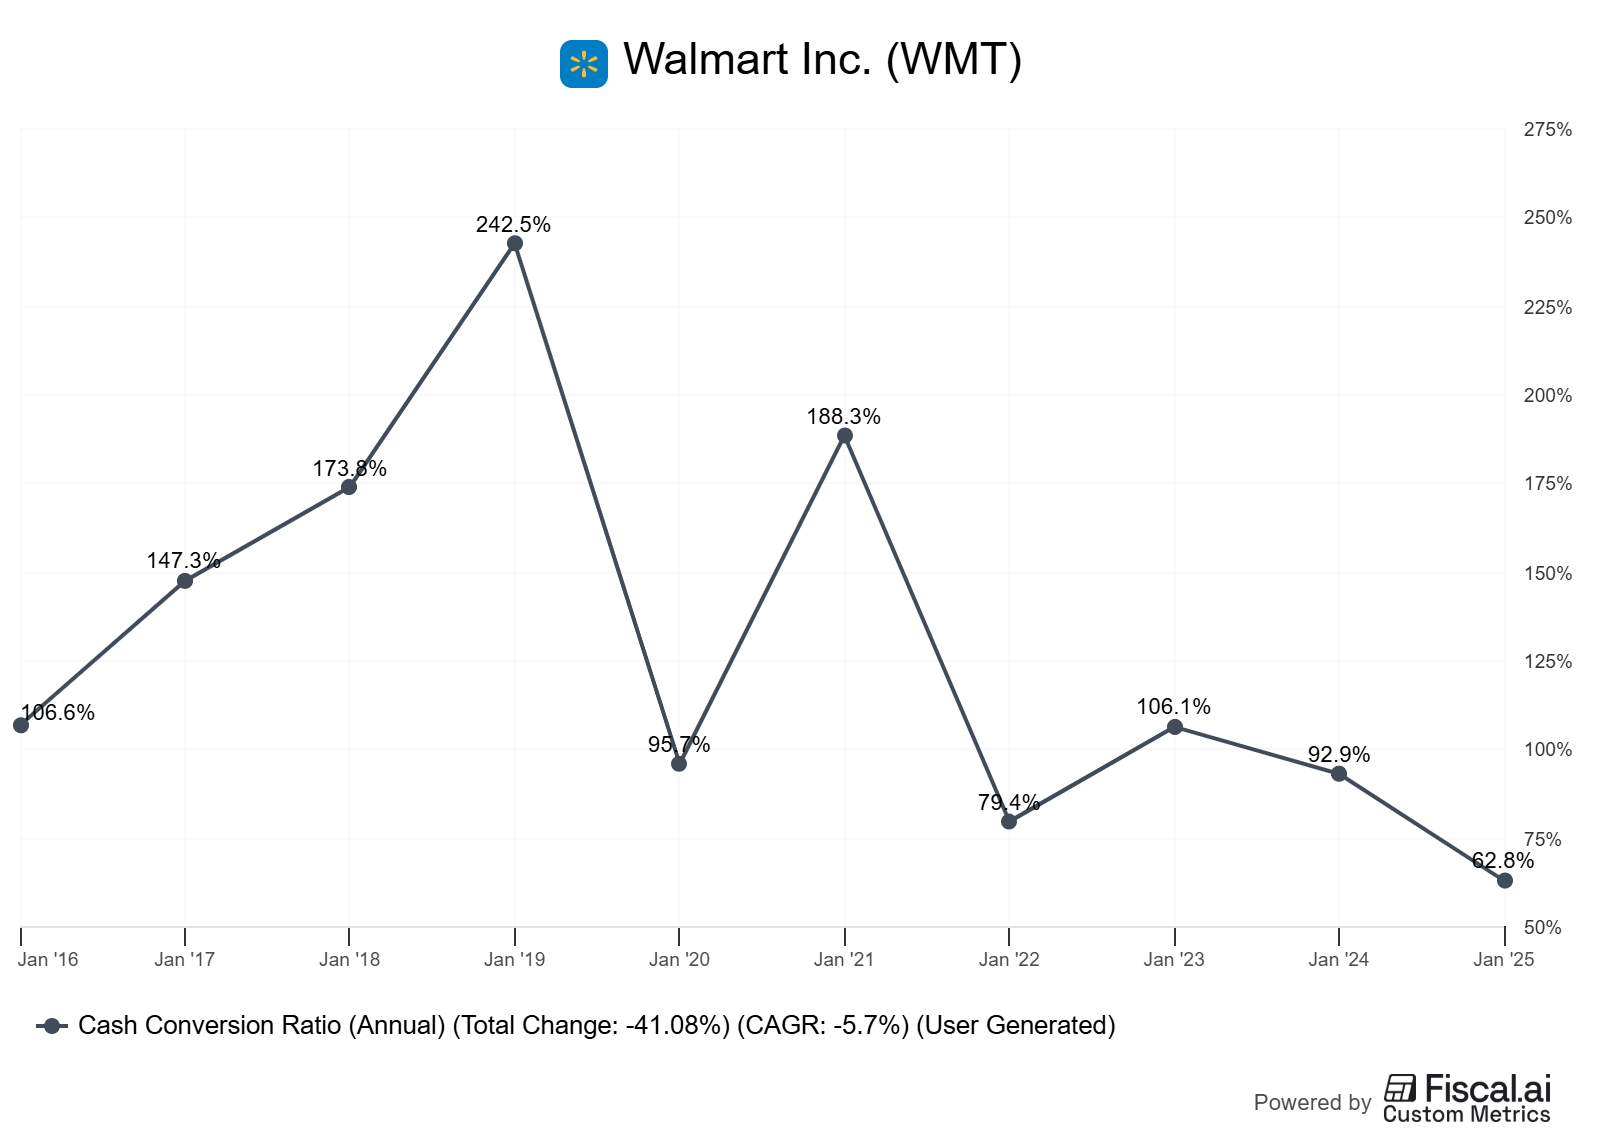
Walmart’s conversion rate of 62.9% is still respectable but notably lower than Meta’s. This makes perfect sense when you think about their business model. Walmart operates over 10,750 physical stores globally, runs massive distribution centers, maintains a huge truck fleet, and is investing heavily in e-commerce fulfillment centers and supply chain automation.
The retail business remains far more capital-intensive than digital advertising. Walmart needs to invest in store constantly remodels, new technology, distribution infrastructure, and supply chain improvements to maintain its competitive position.
Comparing the Two Business Models
Now that we understand both companies, let’s discuss what these numbers really tell us.
Meta’s 83.5% conversion rate reflects the beauty of asset-light, digital business models. Once the core infrastructure is built, additional revenue flows through with minimal additional capital requirements. It’s like building a toll booth - high upfront cost, but then cars keep paying to cross with minimal additional investment needed.
Walmart’s 62.9% rate reflects the reality of physical retail. They need to continuously invest in their stores, logistics, and technology to stay competitive. Every new store, every distribution center upgrade, every fleet modernization eats into their free cash flow.
But here’s the thing - neither rate is inherently “better” than the other. They simply reflect different business models with different capital requirements. What matters is whether each company generates sufficient returns on those investments.
What Makes a Good Free Cash Flow Conversion Rate?
So what should investors look for? Well, it depends on the industry, but here are some general guidelines:
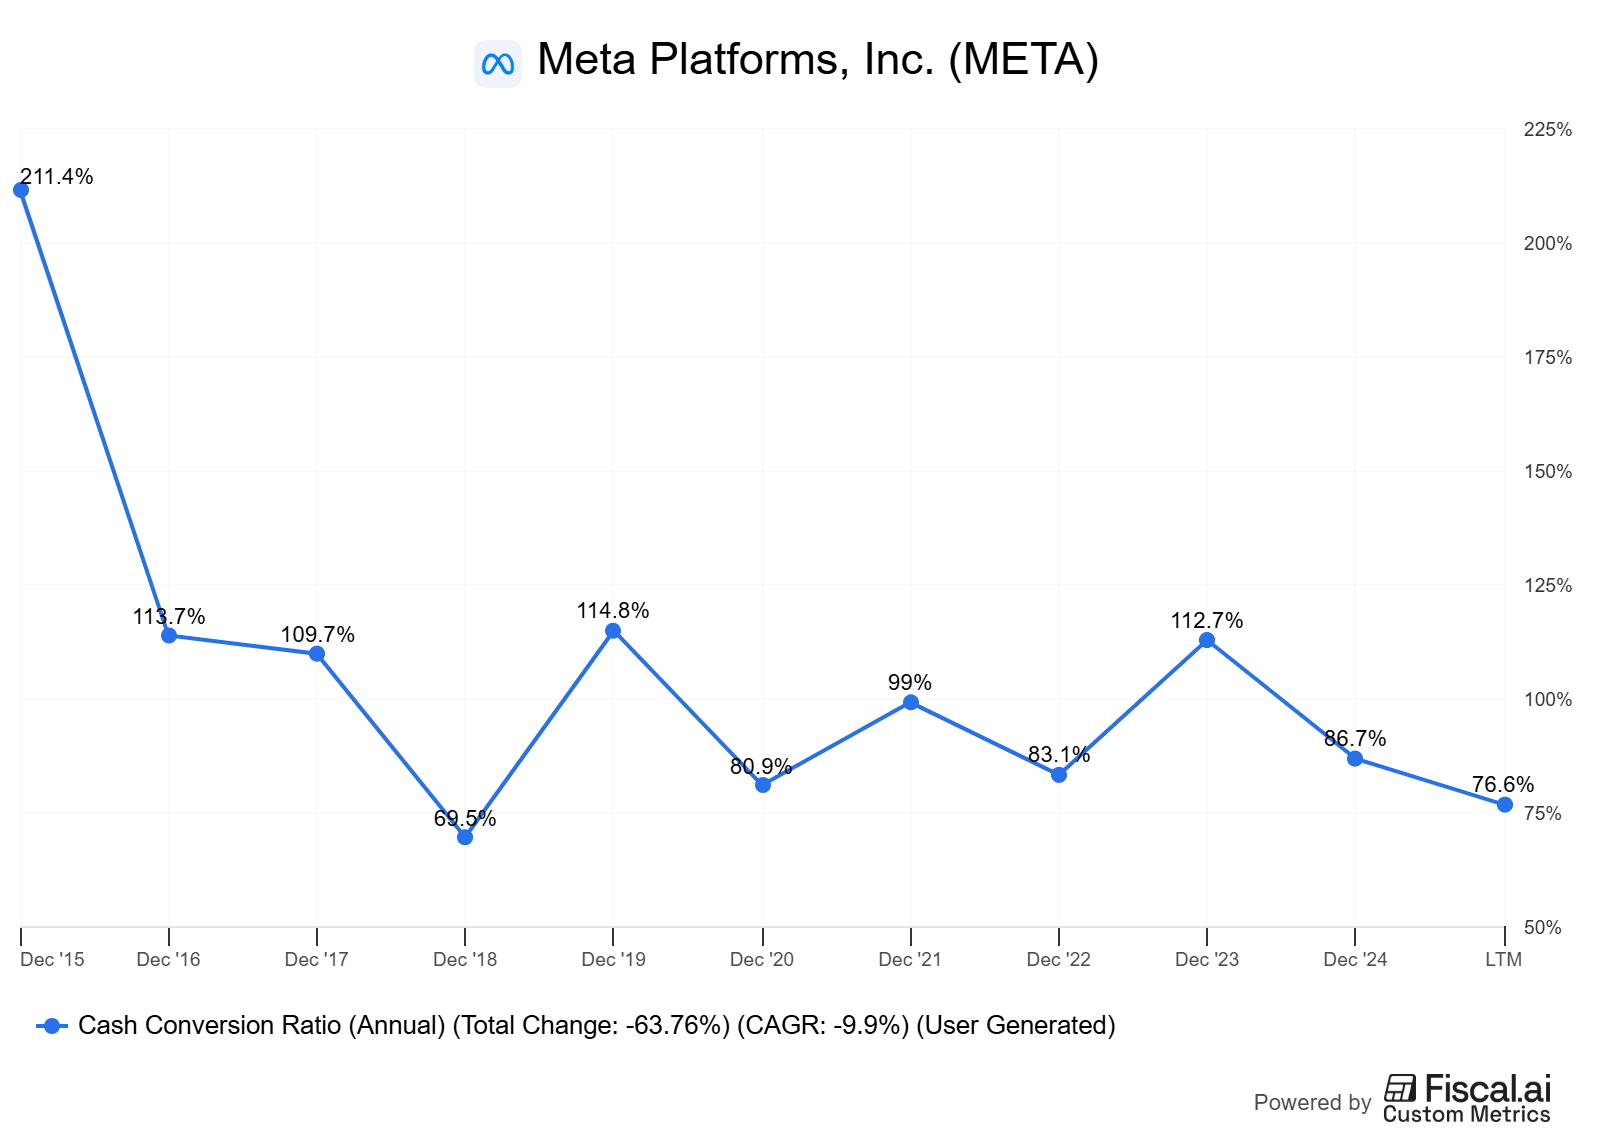
Above 100%: This can happen temporarily when companies reduce capital spending or improve working capital. Meta achieved this in some individual quarters. It’s usually not sustainable long-term.
70-100%: This remains excellent territory. Companies in this range have significant financial flexibility and typically operate asset-light business models.
50-70%: This is solid for most companies, especially those in capital-intensive industries. Many successful retailers, manufacturers, and utilities fall in this range.
Below 50%: This warrants closer inspection. The company might be in a heavy investment phase, operate in a very capital-intensive industry, or have efficiency issues.
Remember that consistency matters too. A company that steadily converts 60% of net income to free cash flow might be more attractive than one that swings between 40% and 80%.
Limitations and Important Considerations
Now, I need to be honest about this metric's limitations. First, free cash flow conversion can be temporarily inflated by cutting necessary investments. A company might boost short-term conversion rates by deferring maintenance or growth capex, but this isn’t sustainable.
Second, the metric doesn’t account for different business lifecycles. Young, growing companies often have lower conversion rates because they’re investing heavily in growth. Mature companies might show higher rates simply because they have fewer growth opportunities.
Third, changes in working capital can distort the picture. A company that collects receivables faster or stretches payables might temporarily boost operating cash flow and conversion rates.
Fourth, different accounting methods can affect net income without impacting cash flow, making comparisons across companies tricky. Always look at trends over multiple years rather than a single period.
Investor Takeaway
Free cash flow conversion remains one of the most important metrics for understanding business quality and financial flexibility. Meta’s exceptional 83.5% conversion rate demonstrates the power of asset-light, digital business models. In comparison, Walmart’s respectable 62.9% rate reflects the ongoing capital needs of physical retail while still generating substantial cash for shareholders.
The bottom line remains that free cash flow conversion helps investors separate companies that generate real, spendable cash from those whose profits exist mainly on paper. It’s not the only metric that matters, but it’s certainly one you should add to your analytical toolkit.
Remember that no single metric tells the whole story. Free cash flow conversion should be evaluated alongside return on invested capital, debt levels, competitive position, and growth prospects. As Warren Buffett reminds us, we’re looking for wonderful companies at fair prices, and understanding cash generation remains crucial to identifying those opportunities.
Don’t get bogged down in finding the “perfect” conversion rate. Instead, focus on understanding why a company’s rate is what it is, whether it’s sustainable, and whether management is allocating that free cash flow wisely.
With that, we will wrap up our discussion today.
As always, thank you for taking the time to read today’s post, and I hope you find something of value in your investing journey. If I can further assist, please don’t hesitate to reach out.
Until next time, take care and be safe out there,
Dave