
TSMC’s AI-Driven Buildout: Translating Capital Intensity Into Intrinsic Value

Capital-intensive winners can look “expensive” at the exact moment they’re creating the most value. Free cash flow compresses as capex surges, even while ROIC stays far above WACC. Today’s artilce shows you how to value those businesses anyway—using a quality lens and a mini case on TSMC, the world’s leading foundry.
TL;DR
Quality lens first: favor businesses with sustained ROIC > WACC and clear reinvestment runways.
Don’t anchor to trough FCF during buildouts; normalize to mid-cycle cash generation and depreciation cadence.
For TSMC, 2024 revenue was approximately $90 billion with 56% gross margins, and 2025 guidance implies around 30% USD growth with a $38–42 billion capital expenditure (as of July 17, 2025) [TSMC 4Q24/2Q25 updates].
Use ROIC – WACC spread (prefer >5% sustained), FCF conversion over a cycle, and per-share metrics to judge quality.
Build a three-scenario, ROIC-aware reverse DCF; test sensitivity to capex intensity, margin band, and growth fade.
Watch false positives: “peak ROIC” at a hot node; FCF suppressed by transient buildouts; FX and policy shocks.
Why it matters
Why it matters
Quality investing is about owning businesses that compound value because their returns on invested capital consistently exceed their cost of capital.
When a company can reinvest large amounts at attractive returns, time becomes your ally.
TSMC is a prime example in today’s market: it operates at the critical junction of AI and high‑performance computing, it benefits from scale and process leadership, and it has customer relationships that are hard to displace. The catch is that this advantage is capital‑hungry. Periods of heavy investment can temporarily mask underlying economics, especially if you focus only on near‑term free cash flow.
That is exactly where investors can misread the story.
For 2025, management has signaled another big build year with capital expenditures guided to roughly $38–$42 billion and USD revenue growth around 30%. On the surface, the combination sounds contradictory—why would free cash flow not surge with that growth? Because the fab buildout and node transitions front‑load cash outlays before they show up as depreciation, which means free cash flow can lag the income statement for a while.
The key to quality investing here is distinguishing between structurally weak unit economics and a cyclical cash trough created by reinvestment.
If you believe TSMC’s returns remain comfortably above its cost of capital and demand visibility is durable, then heavy capex is not a red flag; it is the engine that fuels the next leg of compounding.
Core concepts
ROIC vs WACC and value creation
ROIC (return on invested capital) measures operating profit after tax over the capital required to earn it.
WACC (weighted average cost of capital) is the blended cost of debt and equity.
If ROIC > WACC, each incremental dollar invested creates value. The spread magnitude and duration matter.
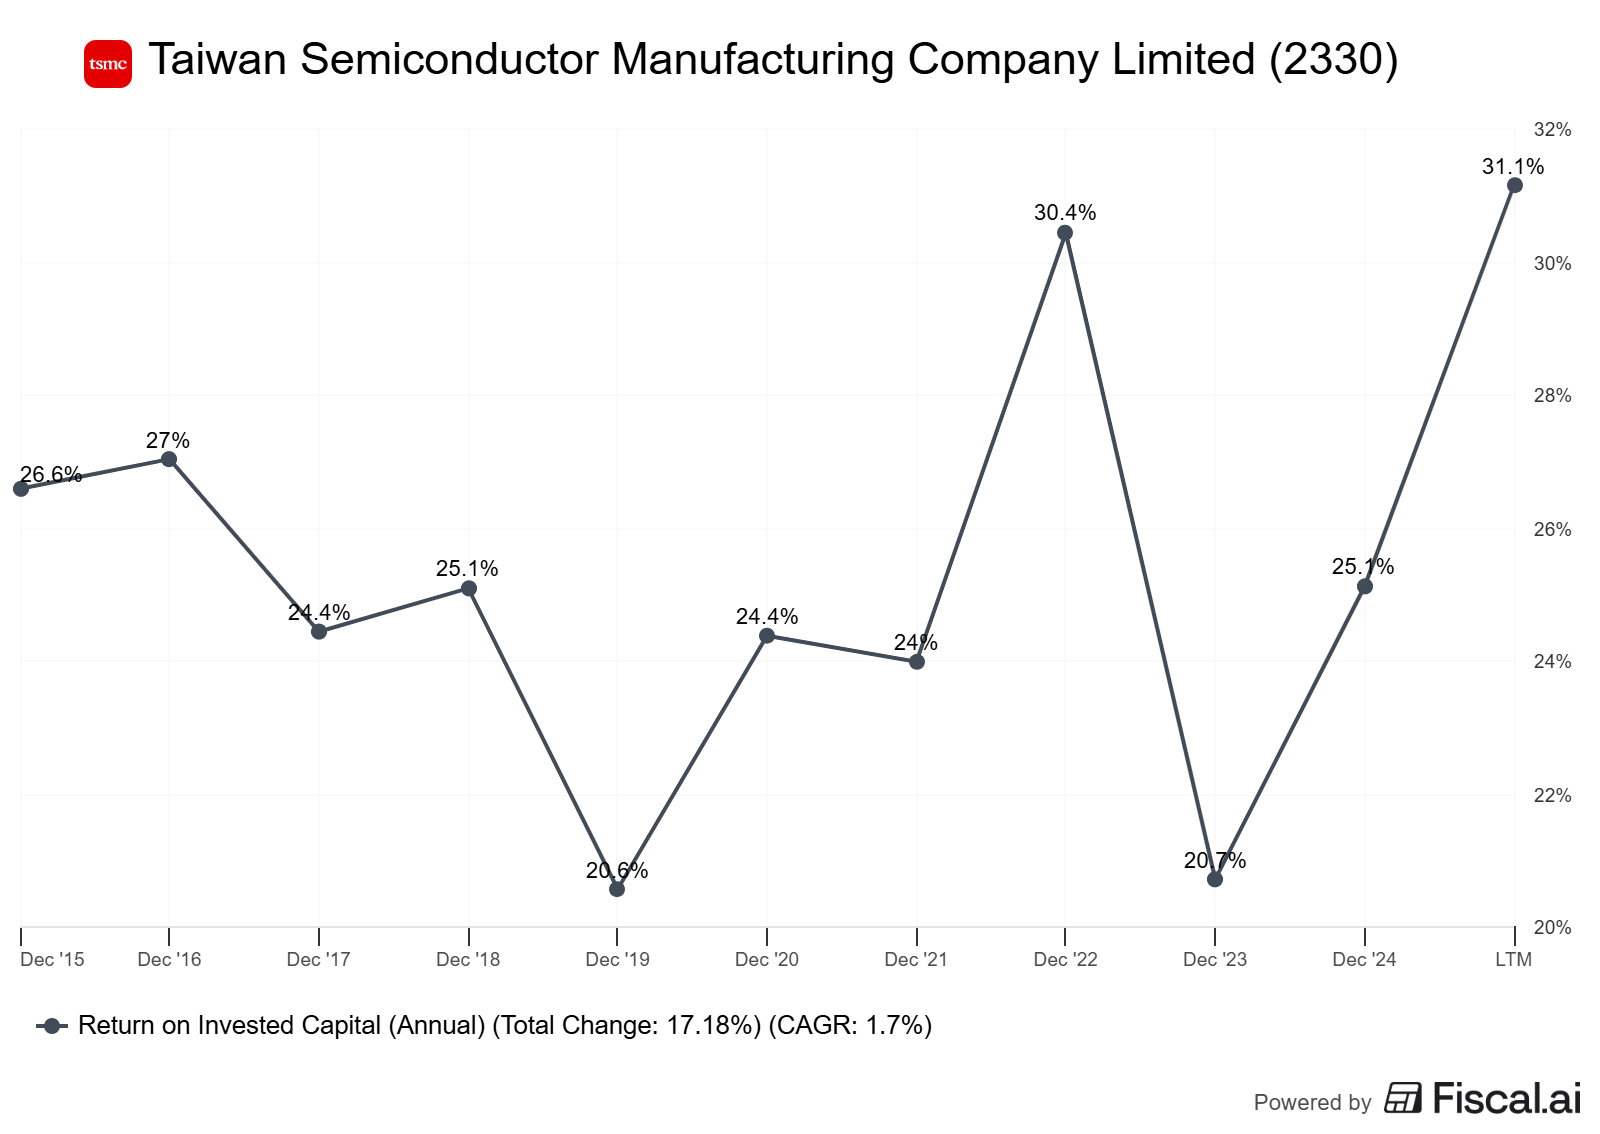
Indicative datapoints for TSMC as reference: third-party sources estimate ROIC near 40% and WACC around 12–13% as of mid-2025, implying a large positive spread [GuruFocus ROIC and WACC, as of 2025-09-20/17].
Reinvestment runway and capital intensity
High intensity ≠ bad. It’s a lever: if marginal returns exceed WACC, more invested capital can accelerate compounding.
The discipline: invest when incremental ROIC clears a hurdle, and maintain pricing power through nodes/transitions (e.g., 5nm → 3nm → 2nm).
In capex super-cycles, use mid-cycle FCF; do not “penalize” the entire valuation for temporarily depressed FCF.
Unit economics and per-share metrics
Track FCF conversion over a cycle: OCF – capex vs net income and EBITDA.
Add per-share framing: FCF/share and EPS/share trends, and share count changes. SBC (stock-based comp) dilution should be explicitly stated.
In foundries, customer prepayments and subsidies can smooth cash needs—adjust your view of owner earnings accordingly.
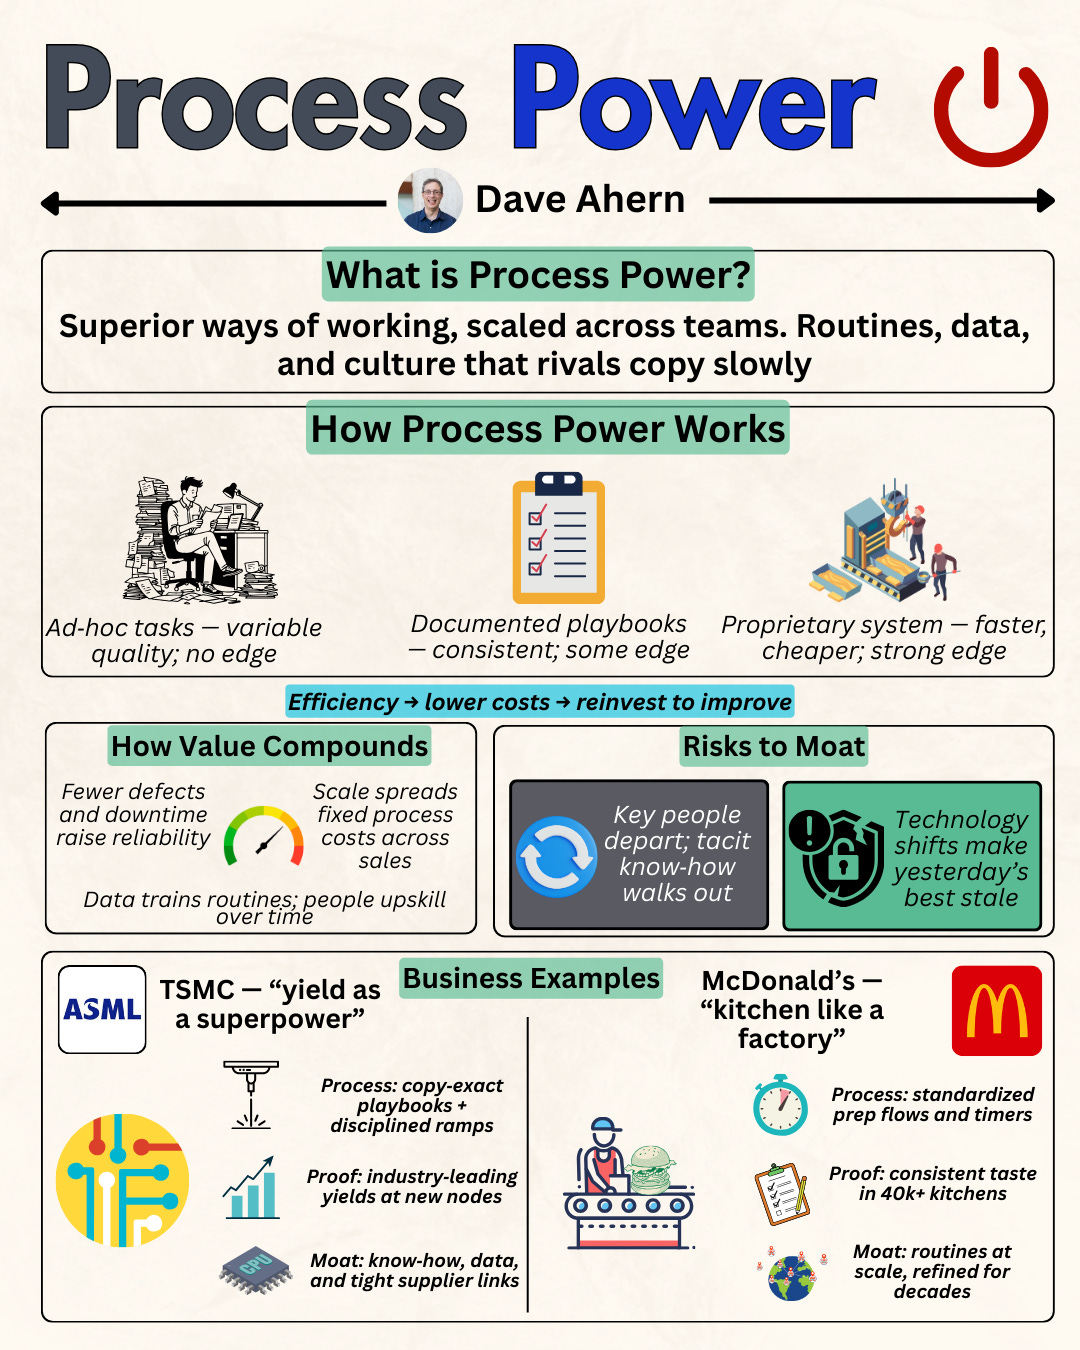
Moat durability and evidence
Evidence, not claims: pricing power at advanced nodes; tight capacity; long-term customer commitments; switching costs (design ecosystem, yield learning, packaging).
For TSMC, management continues to guide long-run gross margin floors above 53% even amid overseas ramp dilution, consistent with pricing power and scale economics (as of July 17, 2025) [Yahoo/Quart transcript; TSMC reports].
Valuation Monday: frameworks and scenarios
On Valuation Monday, the goal is to translate business quality into numbers you can underwrite.
With TSMC, the starting point is to hold two ideas in mind: near-term free cash flow will be dampened by the 2025 capex plan of $38–$42 billion, while underlying earnings power benefits from roughly 30% USD revenue growth as AI/HPC ramps up.
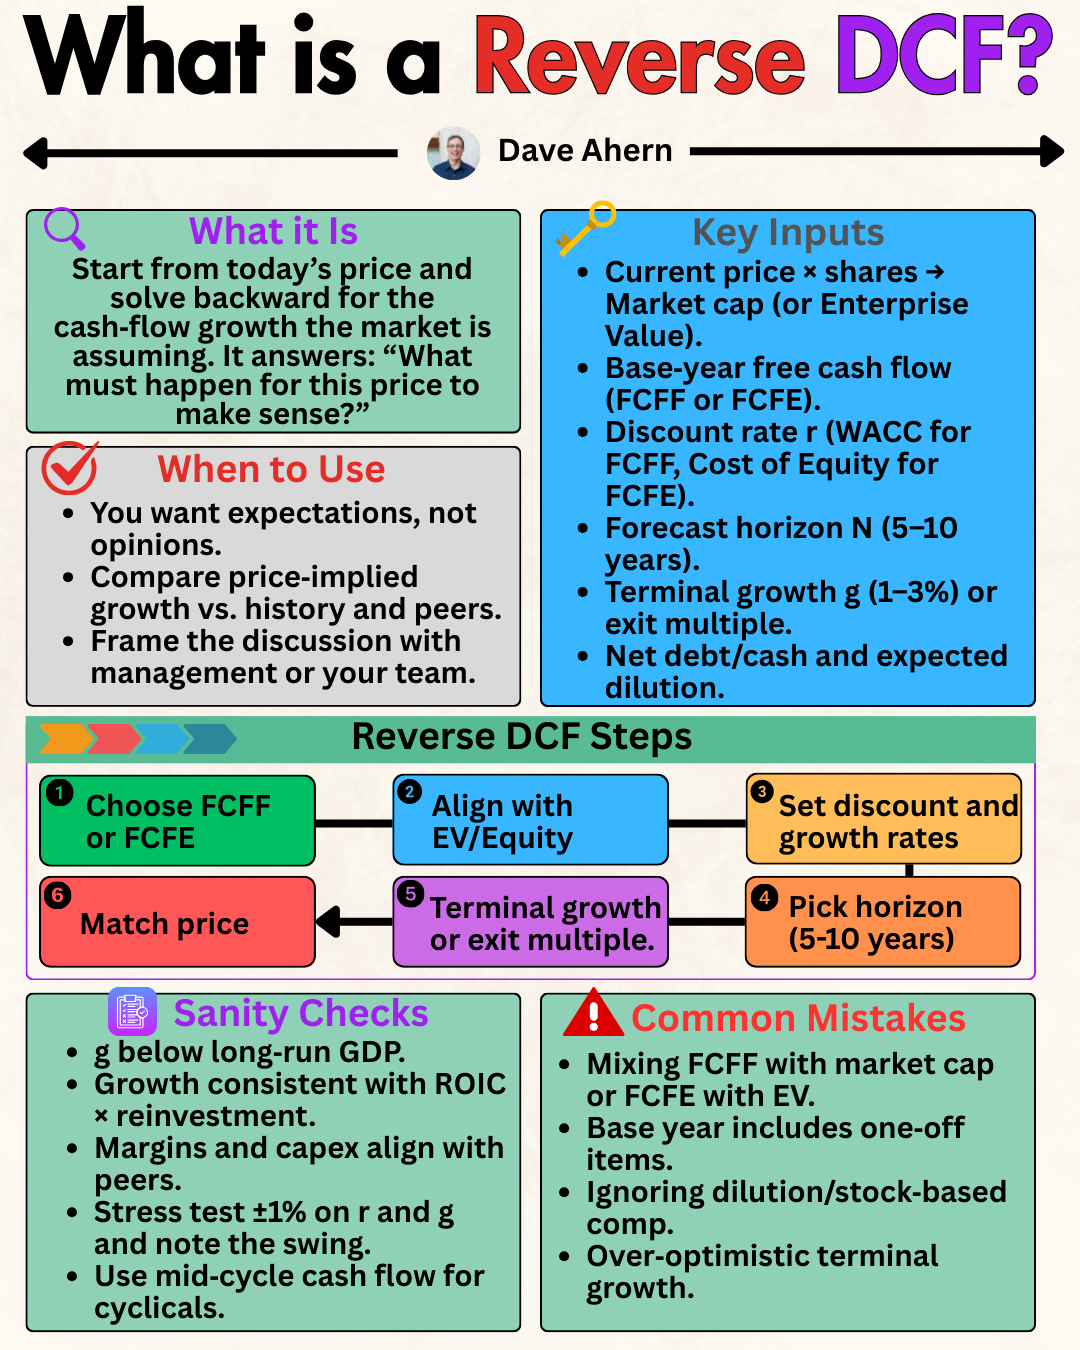
A sensible way to reconcile those is a reverse DCF. Instead of guessing today’s “fair value,” you ask what set of growth, margin durability, and reinvestment assumptions would justify the current price.
The exercise works like this. First, anchor the near term in what management has already guided: strong top-line momentum into 2025, but cash conversion suppressed by the capital expenditure cycle.
Next, extend that into a mid-cycle view where capital expenditure intensity normalizes as the large fabs and advanced nodes reach scale, and depreciation begins to catch up with spending. That’s typically when free cash flow inflects.
Finally, check that the implied long‑run economics are consistent with a business whose returns sit above its cost of capital—i.e., reinvestment still creates value rather than merely sustaining the base.
If the reverse DCF implies that investors must assume permanently elevated capex with no relief, or that growth fades faster than the order book suggests, the bar may be too high. If, instead, it assumes a reasonable glide path—strong 2025 growth, followed by a couple of years of heavy spending, then normalization, you’re evaluating the business on its true economic engine rather than a single year’s cash flow.
Worked example: TSMC
Start from the knowns.
Use 2025 as a bridge year in your model with USD revenue growth around 30% and capex at the midpoint of guidance, about $40 billion. That setup produces healthy operating results but a free‑cash‑flow picture that looks tight because investment is running ahead of depreciation.
Treat that as a feature of the cycle, not a flaw in the business.
Roll the model forward and let capital expenditure intensity step down as the current wave of fabs and advanced nodes stabilizes. As utilization improves and yields mature, operating cash flow benefits from scale while cash outlays begin to fall toward maintenance plus targeted growth. That’s when free cash flow expands, not because the business suddenly changed, but because timing differences between spend and accounting catch up.
In this mid‑cycle state, sanity‑check that returns remain above the cost of capital; if they do, reinvestment continues to add value, and a non‑zero terminal growth rate is defensible.
Now pressure‑test the path. In the base case, 2025 growth is projected to be near 30%, capex is expected to be around $40 billion, and capex intensity is anticipated to ease as planned, allowing free cash flow to inflect as fabs ramp up.
In a downside scenario, utilization lags or tool delivery schedules push capital expenditures higher for longer, which keeps free cash flow subdued and pushes out the inflection point. In an upside case, AI/HPC demand stays hotter for longer, the ramp is smoother, and process leadership translates into faster mix shift to advanced nodes, accelerating cash conversion once the peak spend is behind you.
Across all cases, the signal you’re watching is the relationship between returns and reinvestment. As long as ROIC remains comfortably above the cost of capital, heavy spending is a bridge to more earnings power rather than a hole in the balance sheet.
The practical takeaway is to judge TSMC on normalized free cash flow and mid-cycle economics, rather than on a single year when capital expenditures peak.
Using the same financial anchors—capex of $38–$42 billion for 2025 and USD revenue growth of around 30%, the story remains consistent: this is a high-quality, capital-intensive compounder where the cash flow timing can obscure, but does not erase, the underlying value creation.
How to do this yourself
Steps and sources:
Data to gather
10y revenue, GM/OM, D&A, capex, OCF, SBC, share count; segment mix (HPC/smartphone/etc.).
ROIC (NOPAT / average invested capital) and WACC estimates (or compute).
Working capital turns (DSO/DIO/DPO).
Sources: TSMC annual report and quarterly management reports; consolidated financial statements; monthly revenue; reputable aggregators for time series (Macrotrends, CompaniesMarketCap).2024 report highlights and 4Q24/2Q25 management updates: revenue ~$90.08; GM 56.1%; 2025 capex $38–42B; 2025 growth ~30% in USD; GM floor ≥53% with overseas dilution and FX headwind (as of 2025-07-17) [TSMC 4Q24 report; Yahoo/Quartr transcript; Barron’s/TrendForce summaries].
Exact checks/calculations
Normalize margins: use a 3–5y mid-cycle average excluding the steepest ramp quarters.
Split capex: approximate sustaining vs growth using historical steady-state capex/revenue at similar utilization; treat excess as growth.
ROIC: NOPAT = EBIT × (1 – tax rate). Invested capital = net working capital + net PP&E + capitalized intangibles (if any) – non-interest-bearing liabilities, where appropriate.
FCF = OCF – total capex, but also build “owner earnings” using a sustaining capex proxy.
Per-share: FCF/share and EPS/share, along with share count trend.
Decision rules and thresholds
Prefer ROIC – WACC > 5% sustained over 5+ years.
Favor businesses guiding to margin floors that survived prior cycles (e.g., TSMC’s ≥53% GM target).
Look for FCF conversion (OCF/NI) averaging ≥100% over a cycle; FCF/NI may be <100% during buildouts but should mean-revert.
Capex to revenue normalizing to a steady band (e.g., mid/high-20s to low-30s for a leading foundry) within 2–4 years post-peak.
Per-share growth consistent with reinvestment; low dilution; transparent SBC.
Pitfalls and false positives
Mistaking capex peaks for permanent impairment.
Celebrating “peak ROIC” while underestimating competitive catch-up or node mix shift.
Ignoring FX and overseas ramp dilution on margins.
Using aggregate FCF screens to exclude capital-intensive winners exactly when they’re most attractive.
Overtrusting generic WACC/ROIC services without reconciling definitions.
Checklist / one-pager
ROIC vs WACC: Is the spread >5% and durable?
Reinvestment runway: Clear demand visibility and pricing power through next nodes?
Capex path: Identify peak years and normalized band; distinguish sustaining vs growth capex.
Mid-cycle margins: Use banded GM/OM, not current-quarter extremes.
FCF normalization: Build both GAAP FCF and “owner earnings” using sustaining capex.
Per-share: FCF/share, EPS/share, share count, SBC.
Working capital: DSO/DIO/DPO trends aligned with node ramps?
Valuation: Reverse DCF with three scenarios + sensitivity to WACC, margins, capex duration.
Risk log: FX, policy/tariff, subsidy timing, yield ramp, customer concentration.
Glossary
ROIC: Return on invested capital; NOPAT divided by invested capital.
WACC: Weighted average cost of capital; blended cost of equity and debt.
FCF: Free cash flow; operating cash flow minus capital expenditures.
Maintenance capex: Estimated spend required to sustain current operations.
Capital expenditure (capex): Spending aimed at expanding capacity or capabilities.
DSO/DIO/DPO: Days sales/inventory/payables outstanding; working capital efficiency.
Node: Process generation in nanometers/angstroms (e.g., 3nm, 2nm).
CoWoS/SoIC: Advanced packaging technologies used to integrate dies.
Further reading
TSMC Annual Report 2024 (financial performance, margins, growth capex) (as of 2025-01).
TSMC Q2 2025 Earnings Call (transcript via Yahoo/Quartr) (as of 2025-07-17).
Academic: B. Villalonga & S. Damodaran on ROIC, growth, and valuation linkages.
Industry: TrendForce and reputable semi supply-chain trackers on capacity, pricing, and packaging.
References
TSMC 4Q24 Management Report (revenue ~$90.08B USD; GM 56.1%) (as of 2025-01): TSMC 4Q24 Management Report
TSMC Q2 2025 Earnings Call Transcript (revenue $30.1B; GM ~58.6%; DSO ~23 days; inventory ~76 days; 2025 capex $38–42B; FY25 ~30% USD growth; GM floor ≥53%) (as of 2025-07-17): Yahoo Finance/Quartr transcript
Macro time series on revenue (cross-check) (as of 2025-09-20): Macrotrends: TSM revenue
ROIC and WACC snapshots (as of 2025-09-17/20): GuruFocus ROIC, GuruFocus WACC
Capex range reiterated (as of 2025-07-17): Barron’s coverage excerpting TSMC guidance, and TrendForce pre-call brief
Disclaimer
Educational content, not investment advice.