
This Week's Infographics
Collection of the week's infographics

Investing is a challenging game with lots of moving parts. And one of the challenges is learning the language of investing from accounting to finance and more.
Our goal here is to help simplify this process and give you the tools to become a better investor. Infographics are a great tool to help visualize hard ideas and help our brains remember concepts better.
Here are this weeks infographics, enjoy.
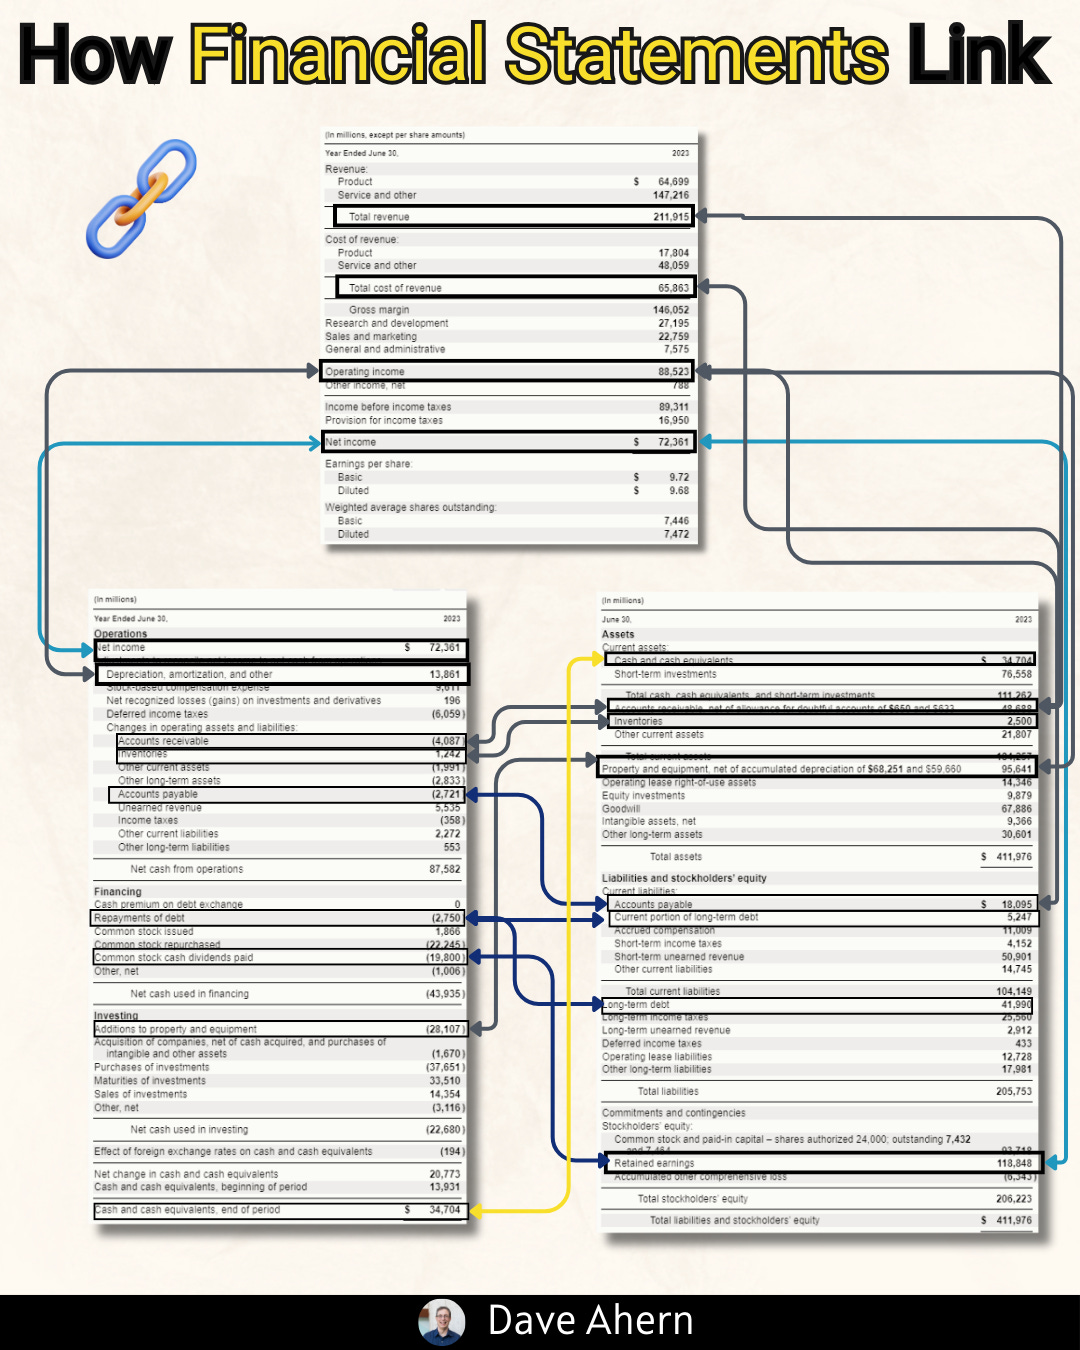
How Financial Statements Link:
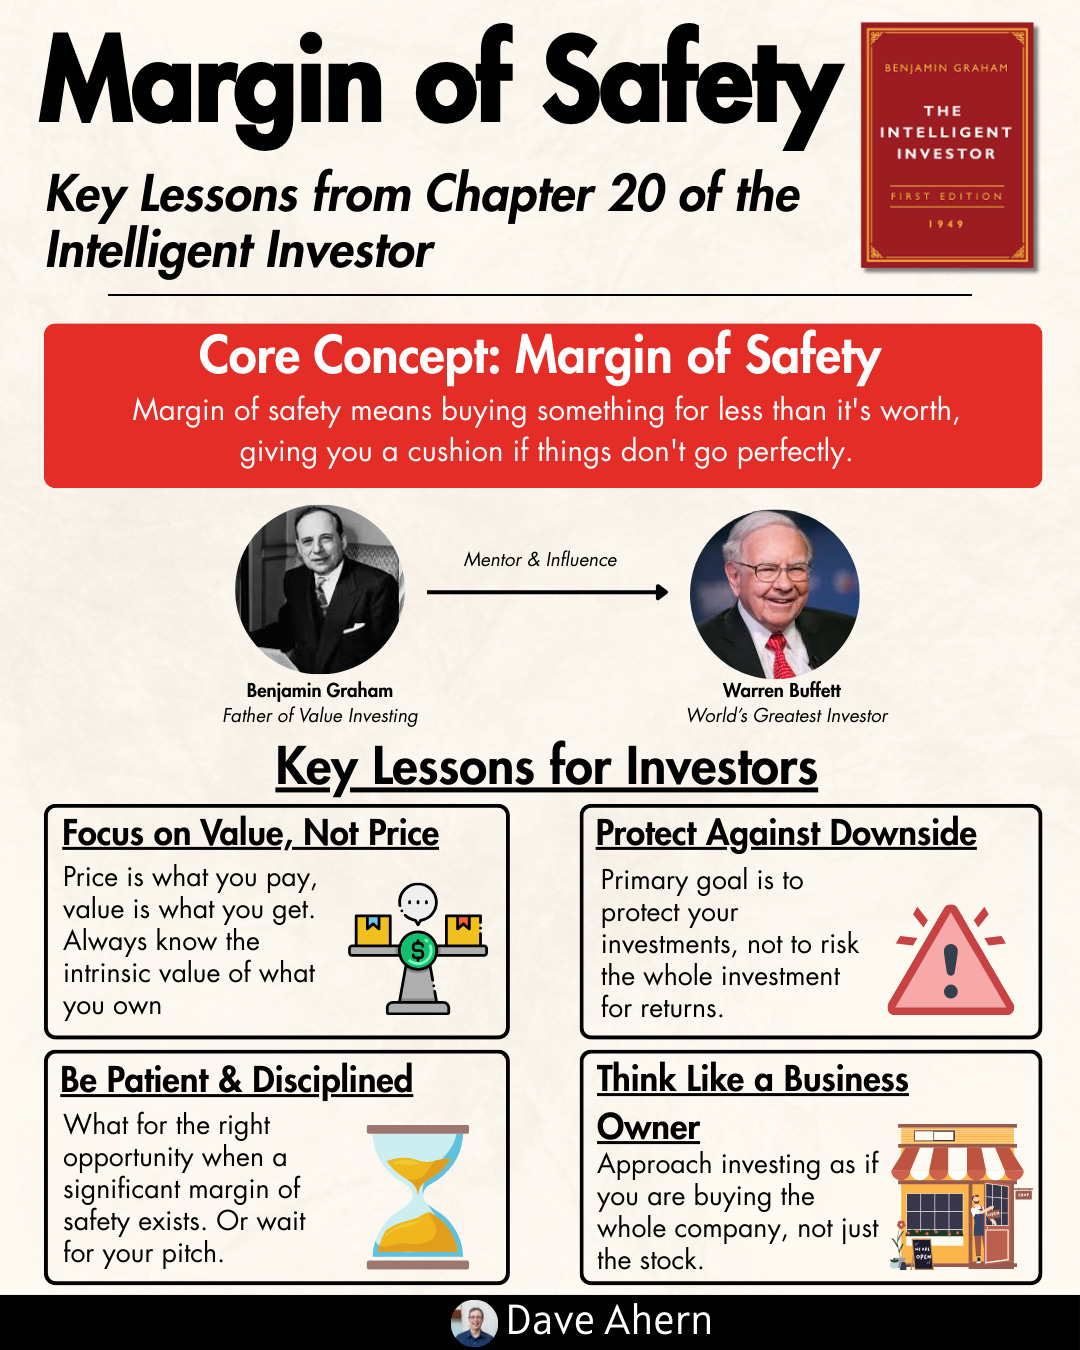
Margin of Safety:
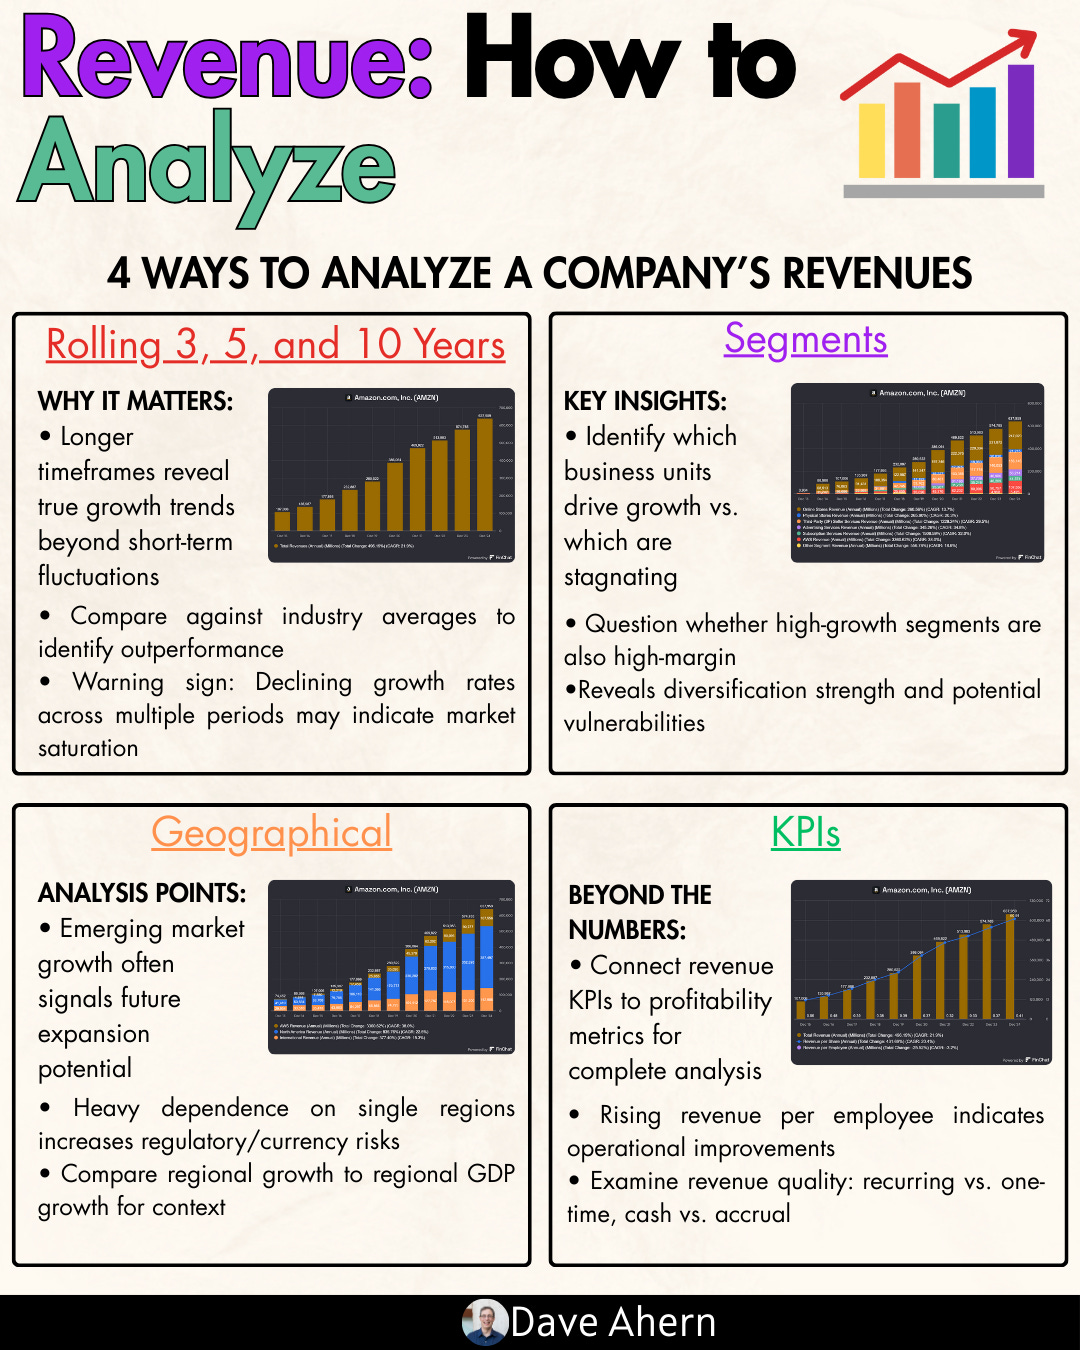
Revenue Analysis:
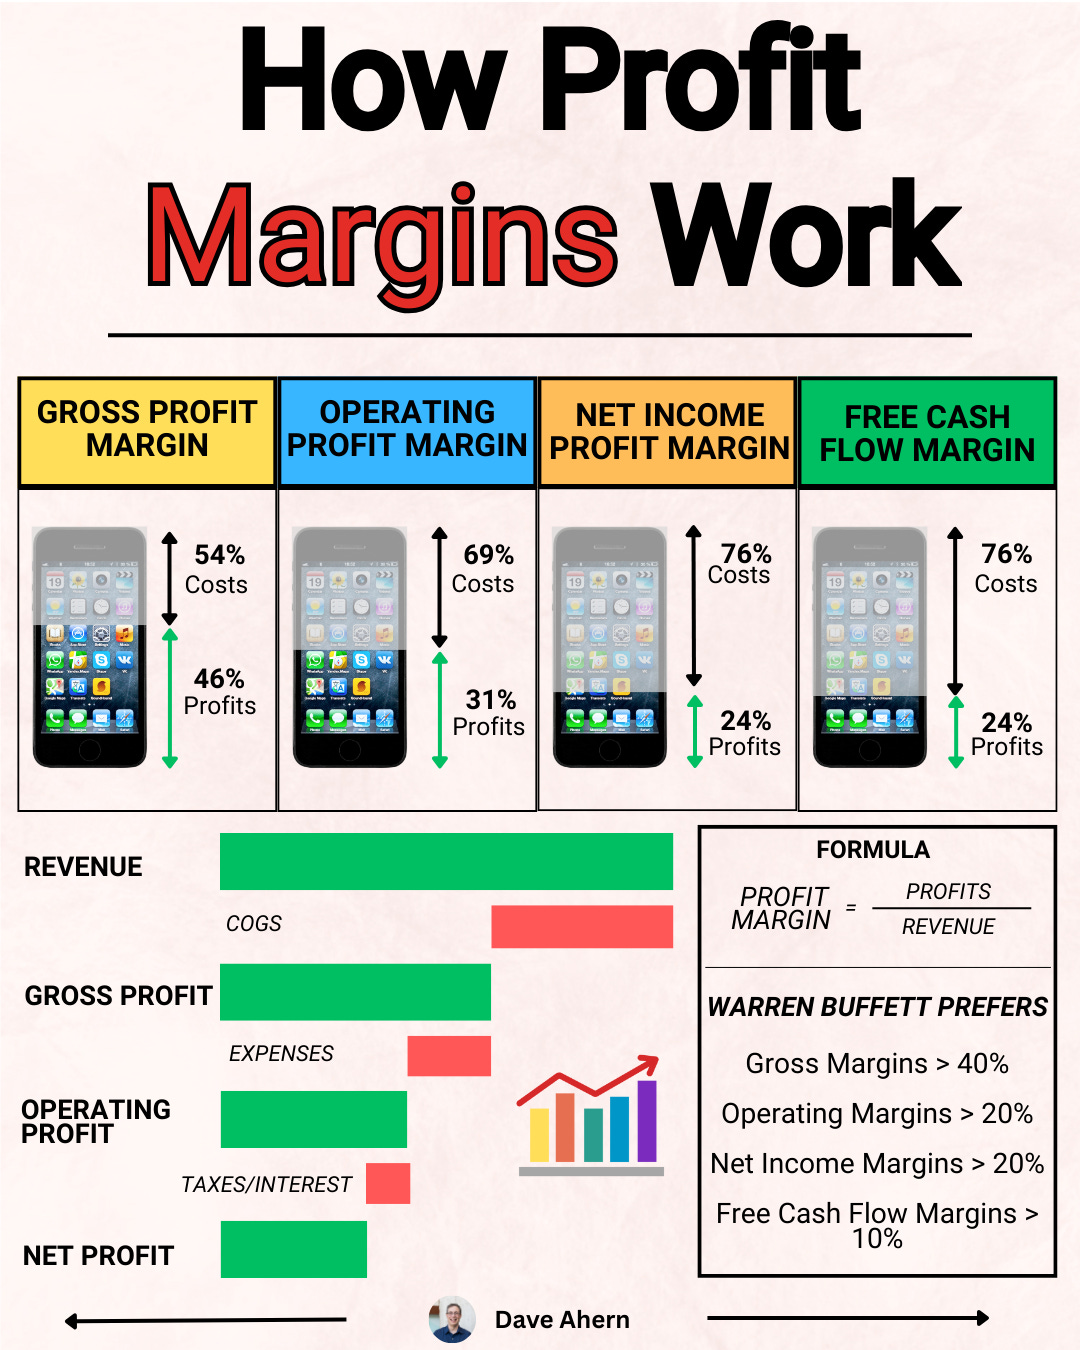
How Profit Margins Work:
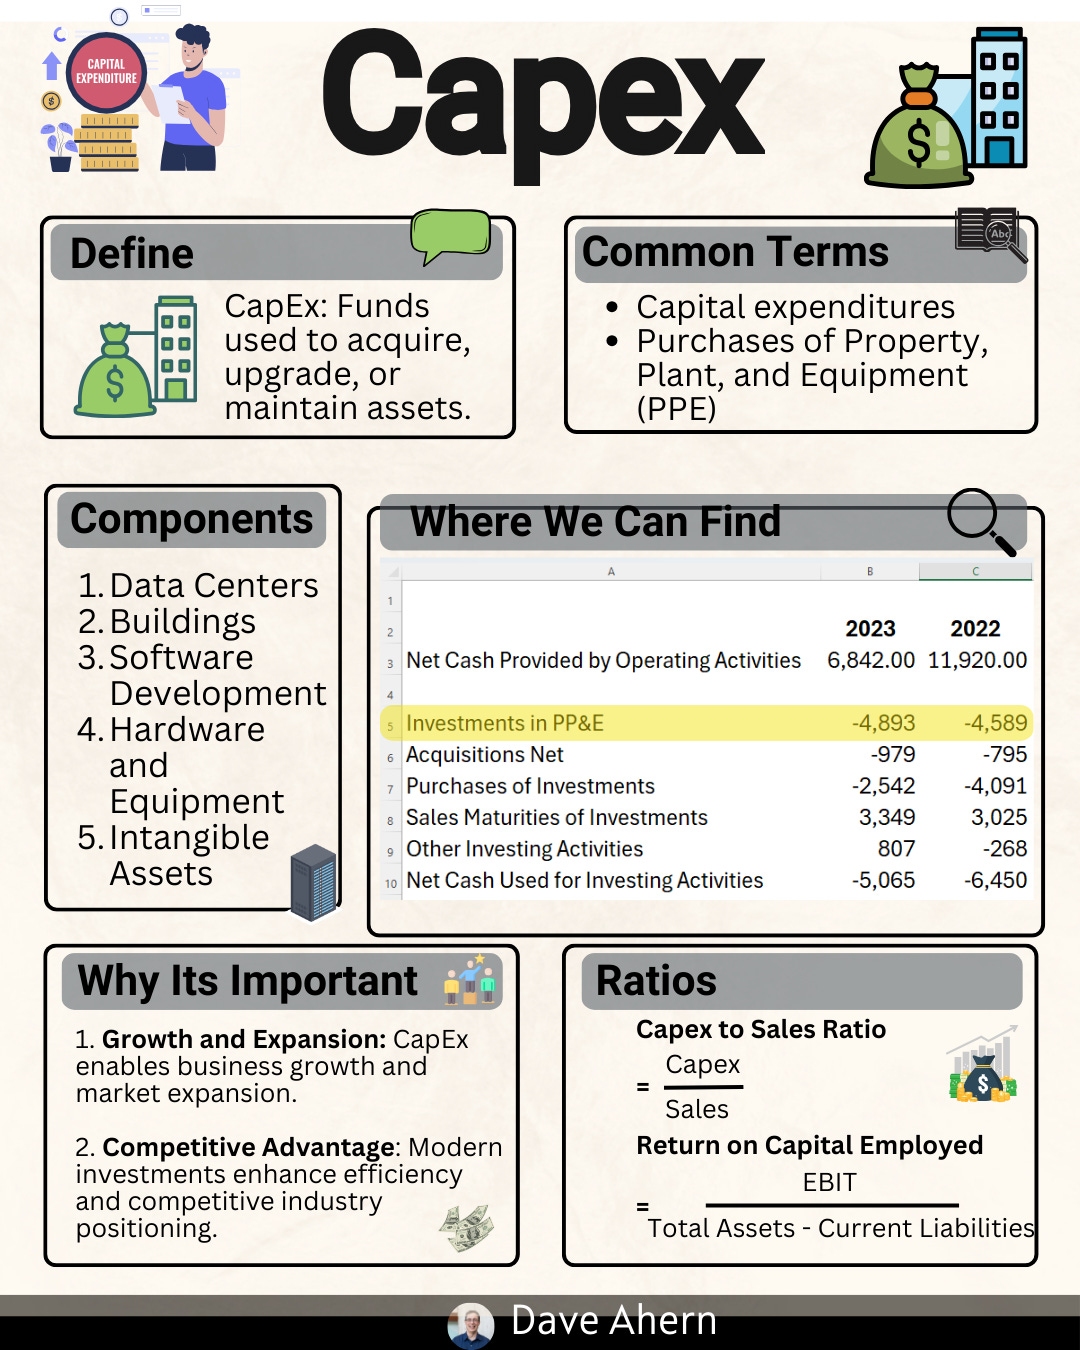
What is Capex:
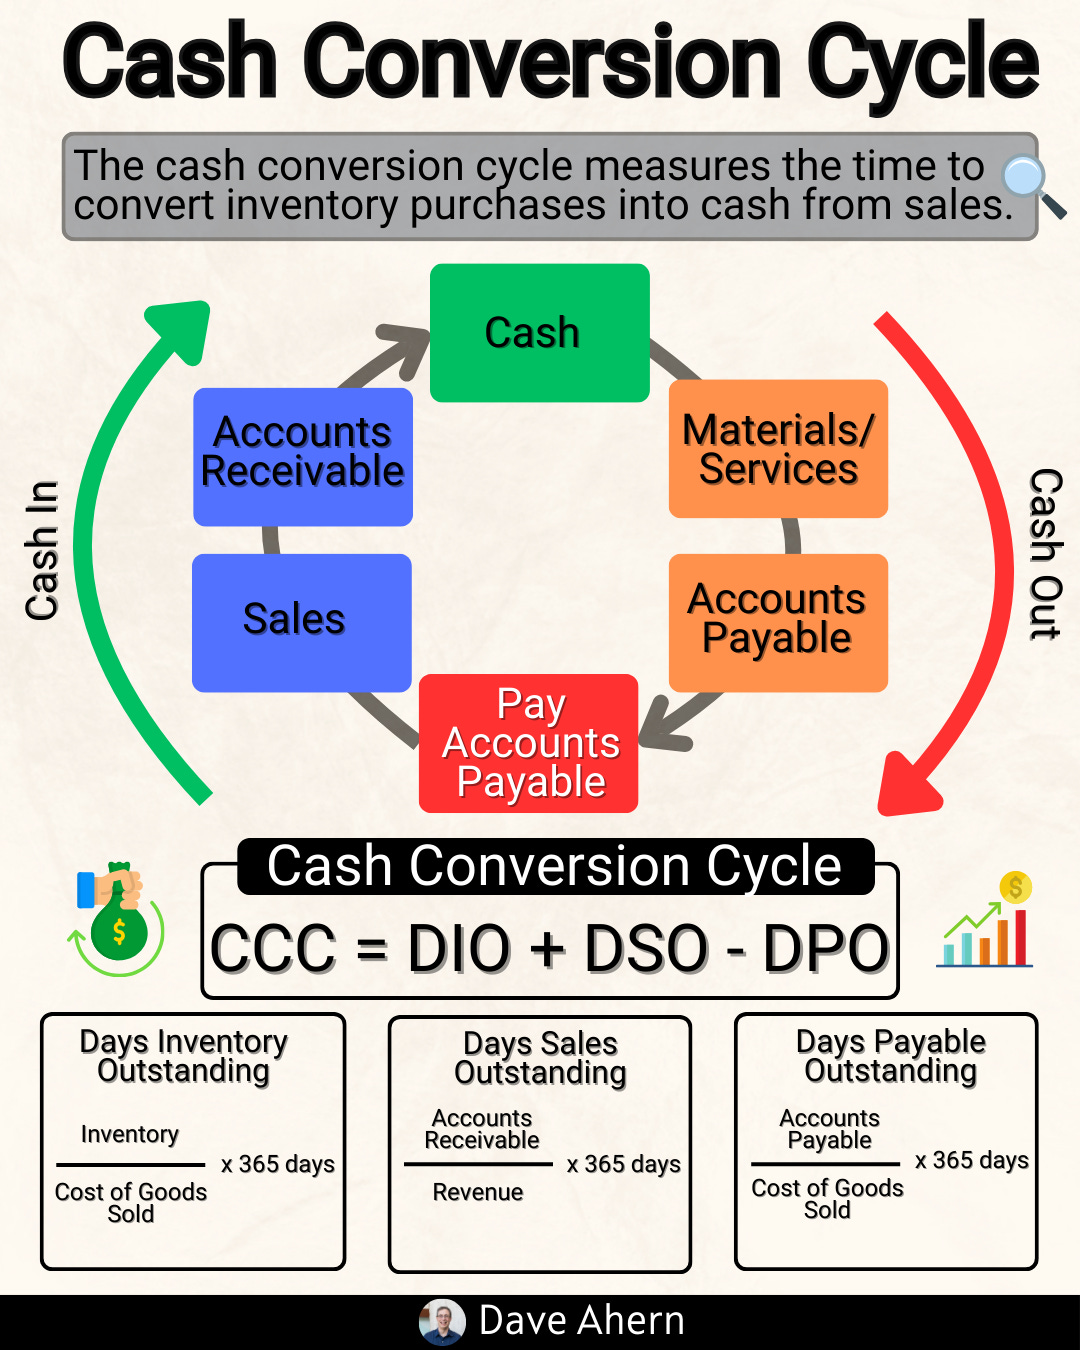
Cash Conversion Cycle:
Cash
That will wrap it up for the week.
Thanks for reading and if you have any questions or would like to see a particular topic covered please don’t hesitate to reach out.
Take care,
Dave