
The Visual Valuation Blueprint: Infographics to Analyze Any Company.

Learning to value companies is probably one of the biggest challenges for any investor. Whether we are new to the market or seasoned professionals, determining a good price is never easy.
Enter metrics such as the P/E ratio, Price-to-Sales ratio, etc.
These are shortcuts to valuation and are a great way to compare others in the same industry or sector.
Today, we will explore some valuation metrics visualized to help you have more tools in your toolkit.
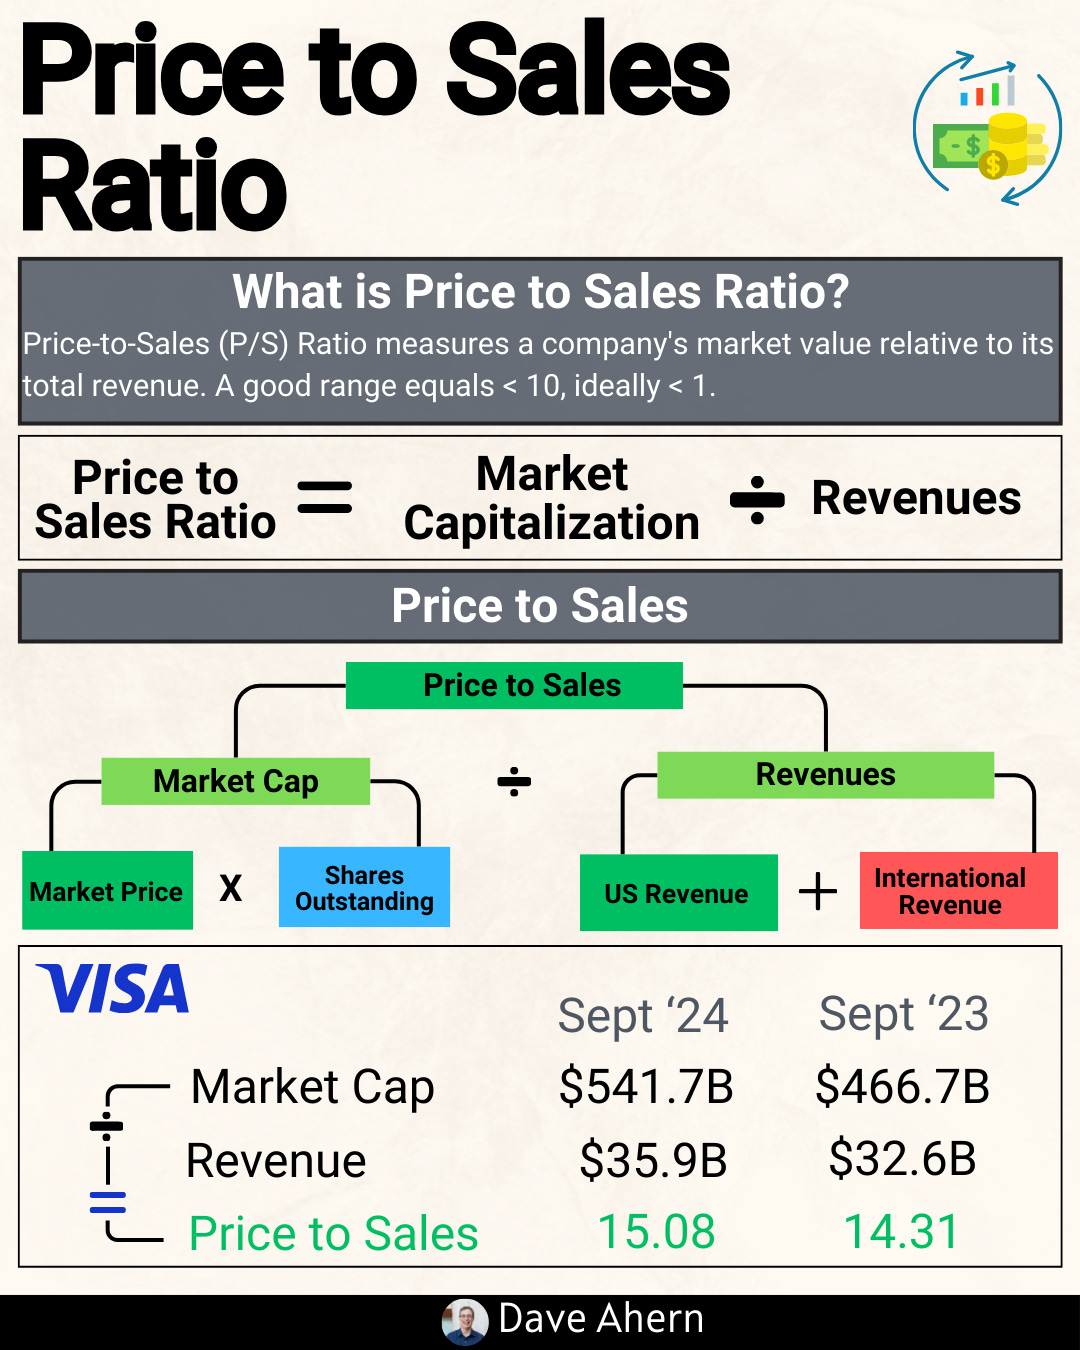
Price to Sales (P/S):
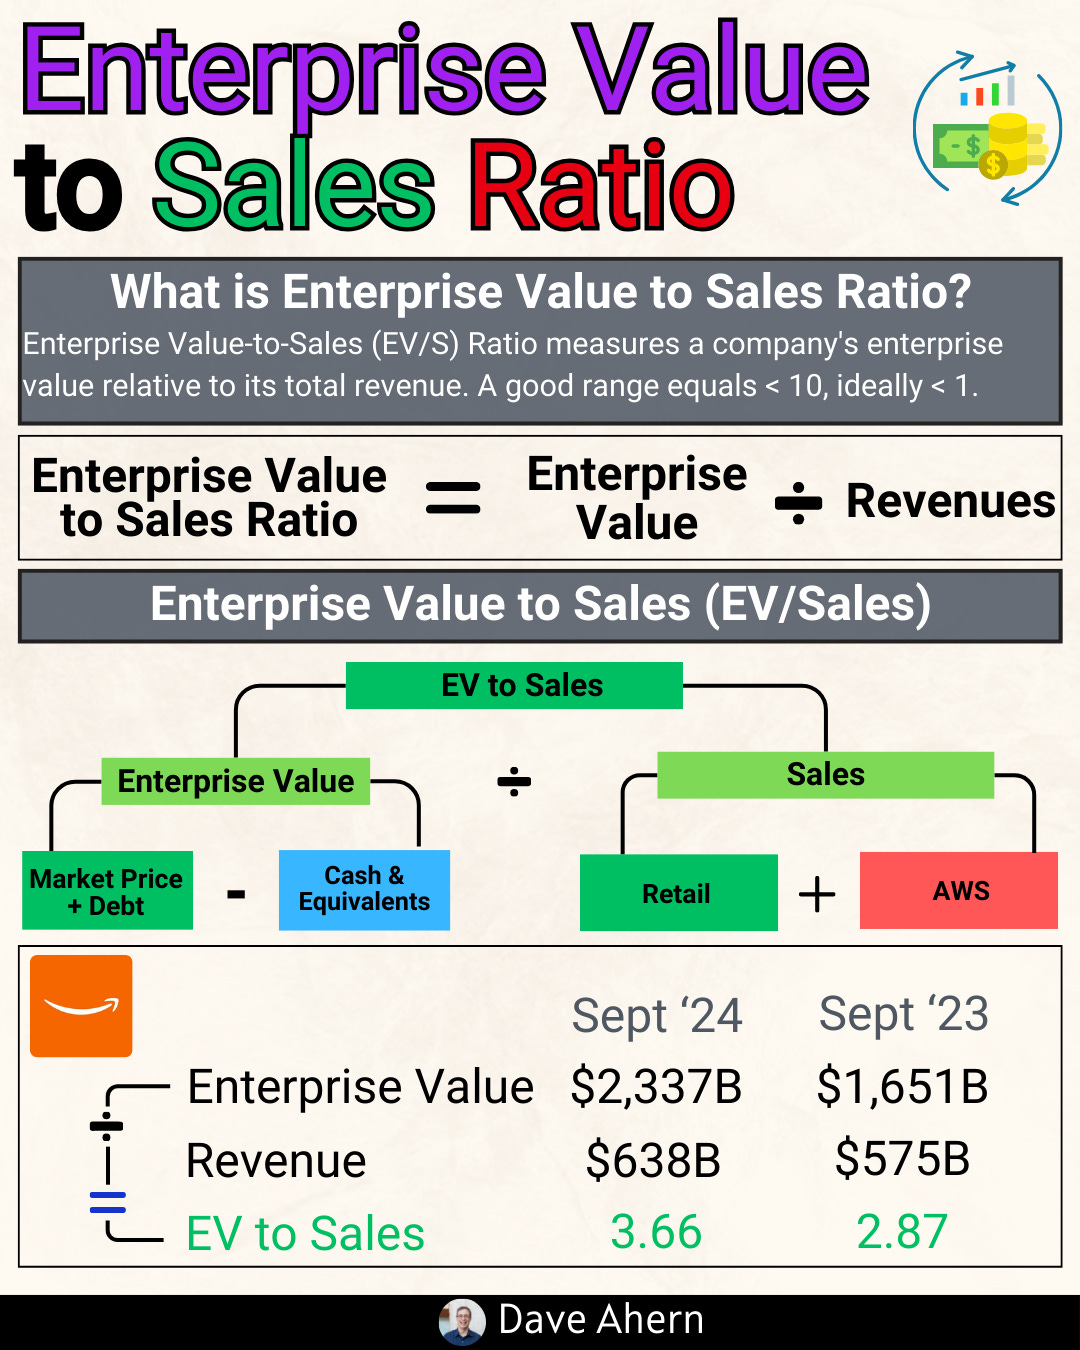
Enterprise Value to Sales Ratio (EV/Sales):
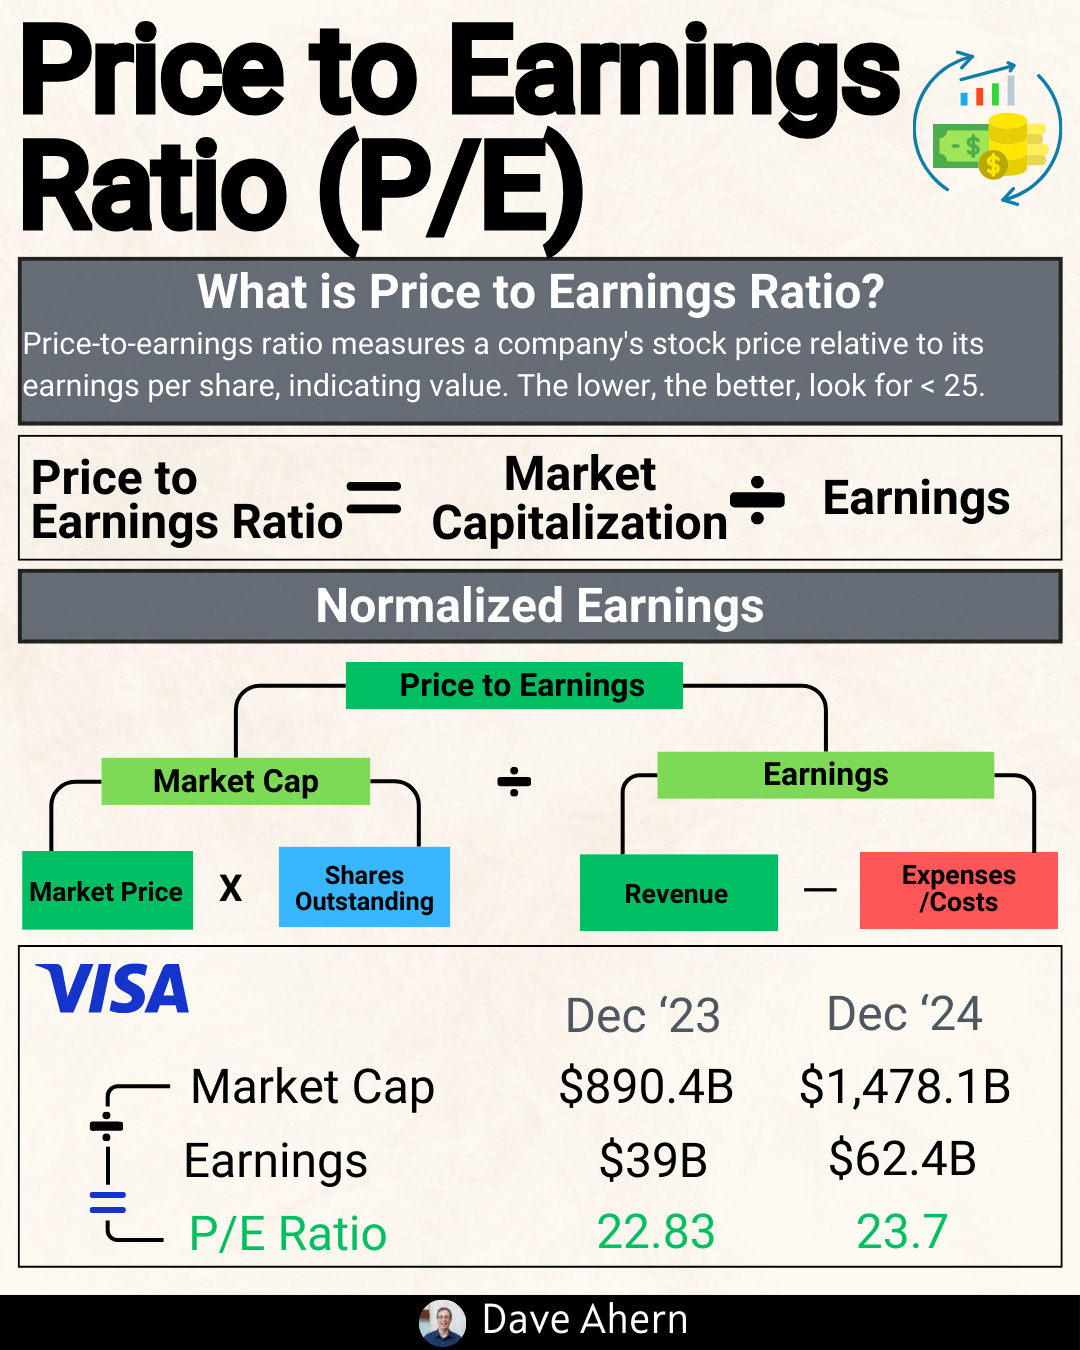
Price-to-Earnings Ratio (P/E):
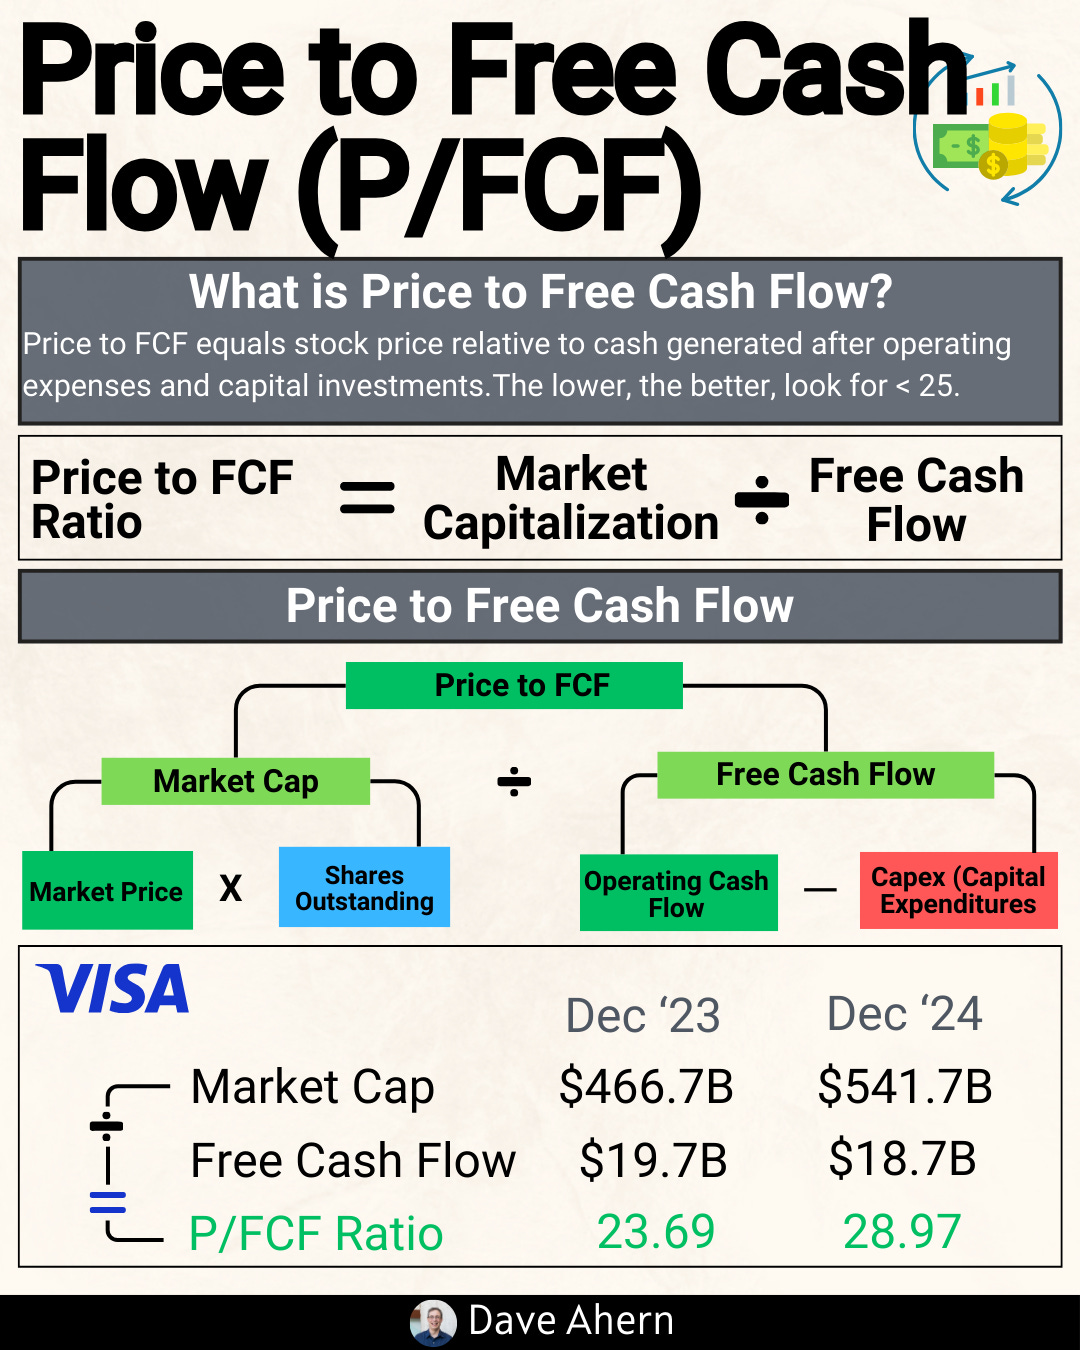
Price-to-Free Cash Flow (P/FCF):
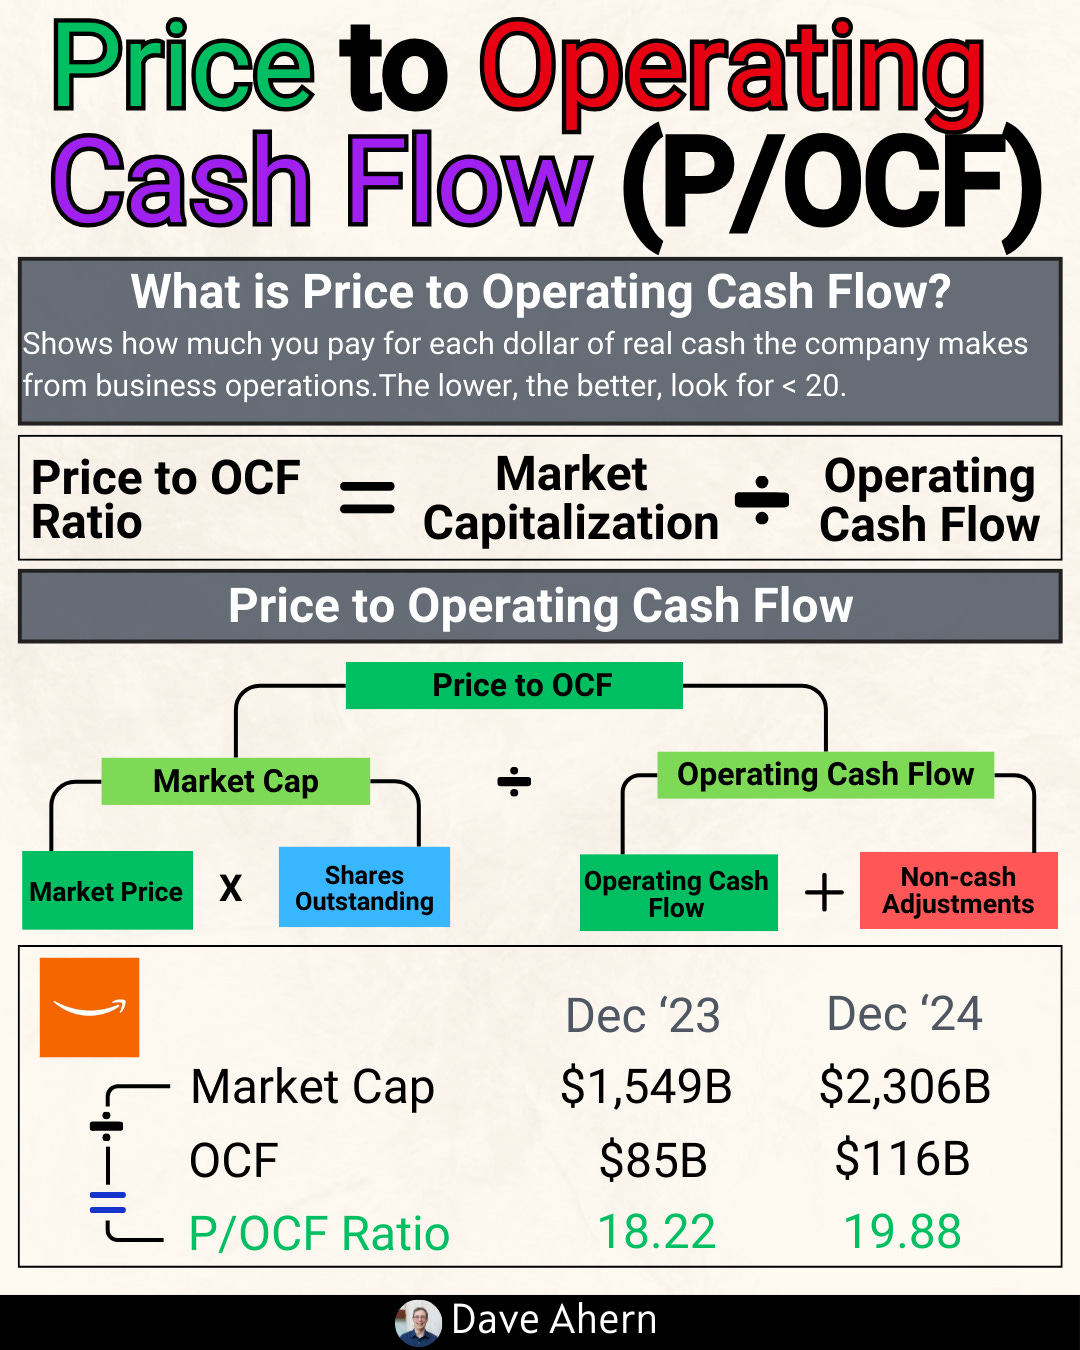
Price-to-Operating Cash Flow (P/OCF):
Free Cash Flow Yield:

That’ll do it for today.
Hope they help and let me know if you have any questions or are interested in seeing something particular.
Take care,
Dave