
The Position Management Playbook: When to Trim, Hold, and Add More

You bought a quality compounder at a fair price. It doubled. Now what?
Most investors either freeze (holding forever regardless of valuation) or panic-sell (trimming winners too early). The middle path requires a systematic framework that balances valuation discipline with the ability to let compounders run.
Today’s article walks through a quantitative decision tree using ASML Holding, a Dutch semiconductor equipment maker, as a live case study, showing exactly when rules suggest trimming, holding, or adding more.
TL;DR
Position management is a skill: Buying well matters, but systematic trim/hold/add rules preserve gains and compound wealth over decades.
Three zones drive decisions: Valuation (price vs intrinsic value), quality trends (ROIC, margins, FCF conversion), and position size relative to portfolio.
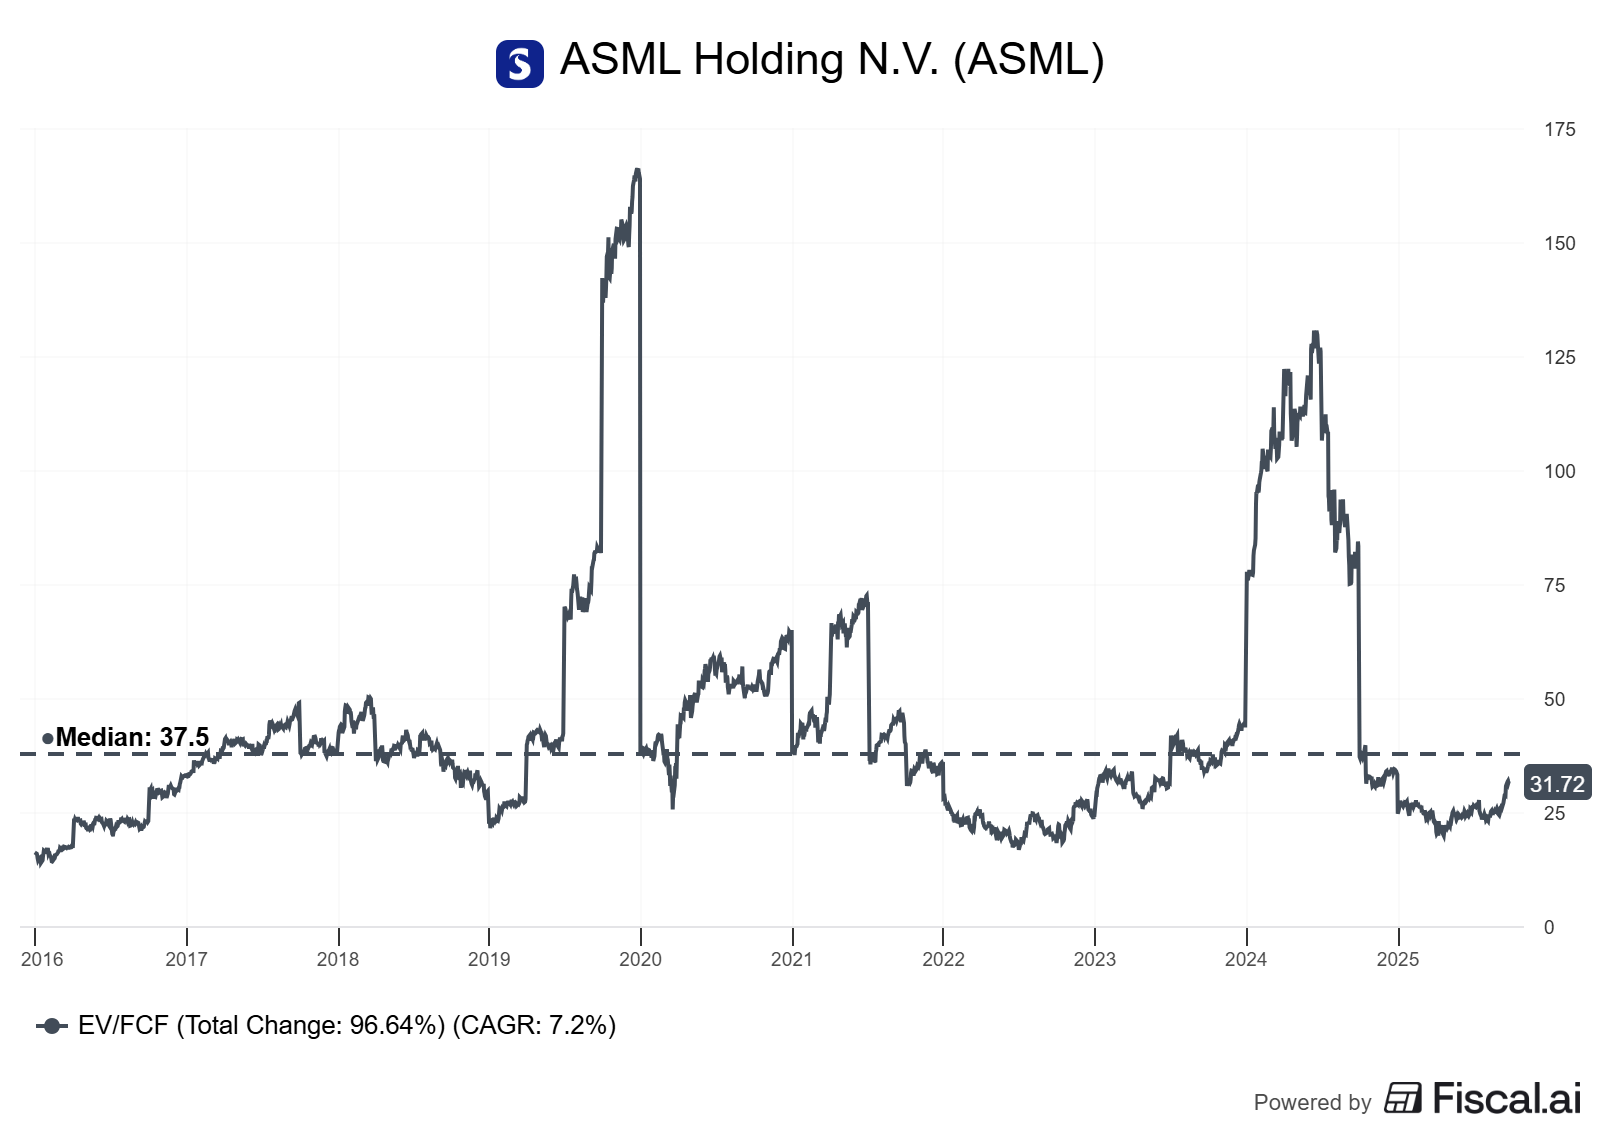
ASML case study: A 5x return since 2019 created natural trim opportunities in 2021-2022 when EV/FCF hit 45x (2x historical median); adds made sense in late 2022 at 20x.
Per-share focus prevents errors: Share count growth, FCF/share trajectory, and buyback discipline matter more than headline revenue growth.
Rules beat emotions: Pre-set thresholds (e.g., trim at >40% above fair value; add at >30% below) remove psychological bias from sell decisions.
Why Position Management Matters
The typical quality investor narrative emphasizes finding durable compounders and holding forever. That works brilliantly when you buy at 15x FCF and the multiple stays there for a decade. It fails when mean reversion strikes, when a 15x compounder re-rates to 45x, then crashes back to 20x while you watch.
Base rates on valuation cycles: Research from O’Shaughnessy Asset Management shows that high-quality stocks trading above 2 standard deviations from their historical valuation median revert to the mean within 3 years roughly 70% of the time (as of 2023 study). Ignoring valuation extremes leaves 30–50% of potential gains on the table through missed trim opportunities.
Where investors go wrong: Two failure modes dominate. First, premature trimming, selling a 25% winner at 18x FCF when intrinsic value justifies 22x, driven by fear of giving back gains. Second, anchoring to cost basis, refusing to add at attractive valuations because “it’s up 3x from where I bought.” Both errors stem from lacking systematic rules that separate emotion from math.
The quality-investing lens demands both discipline: hold compounders when they deliver predictable cash flow growth at reasonable valuations, but trim when valuations embed perfection that management can’t deliver. Position management is the mechanism.
Core Framework: The 3-Zone Decision Model
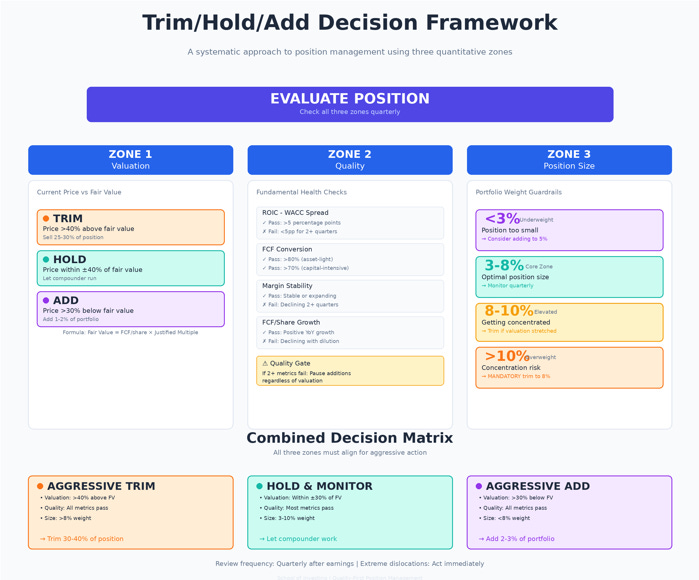
A robust trim/hold/add system balances three inputs: valuation, quality trends, and position sizing. Each zone has quantitative thresholds that trigger action.
Valuation Zone: Price vs Intrinsic Value
Intrinsic value isn’t a point estimate; it’s a range. Calculate a base-case fair value using normalized FCF and a justified multiple (often the 5–10 year median EV/FCF adjusted for changes in ROIC and growth).
Then define bands: trim when price exceeds fair value by 40%+ (upside exhausted), add when price sits 30%+ below fair value (margin of safety restored), and hold in between.
Math example: If fair value is $600/share based on $25/share FCF and a 24x multiple, trim zones start at $840+ (40% premium), add zones activate below $420 (30% discount), and hold applies from $420–$840. These aren’t rigid; adjust for changing fundamentals, but they remove emotion.
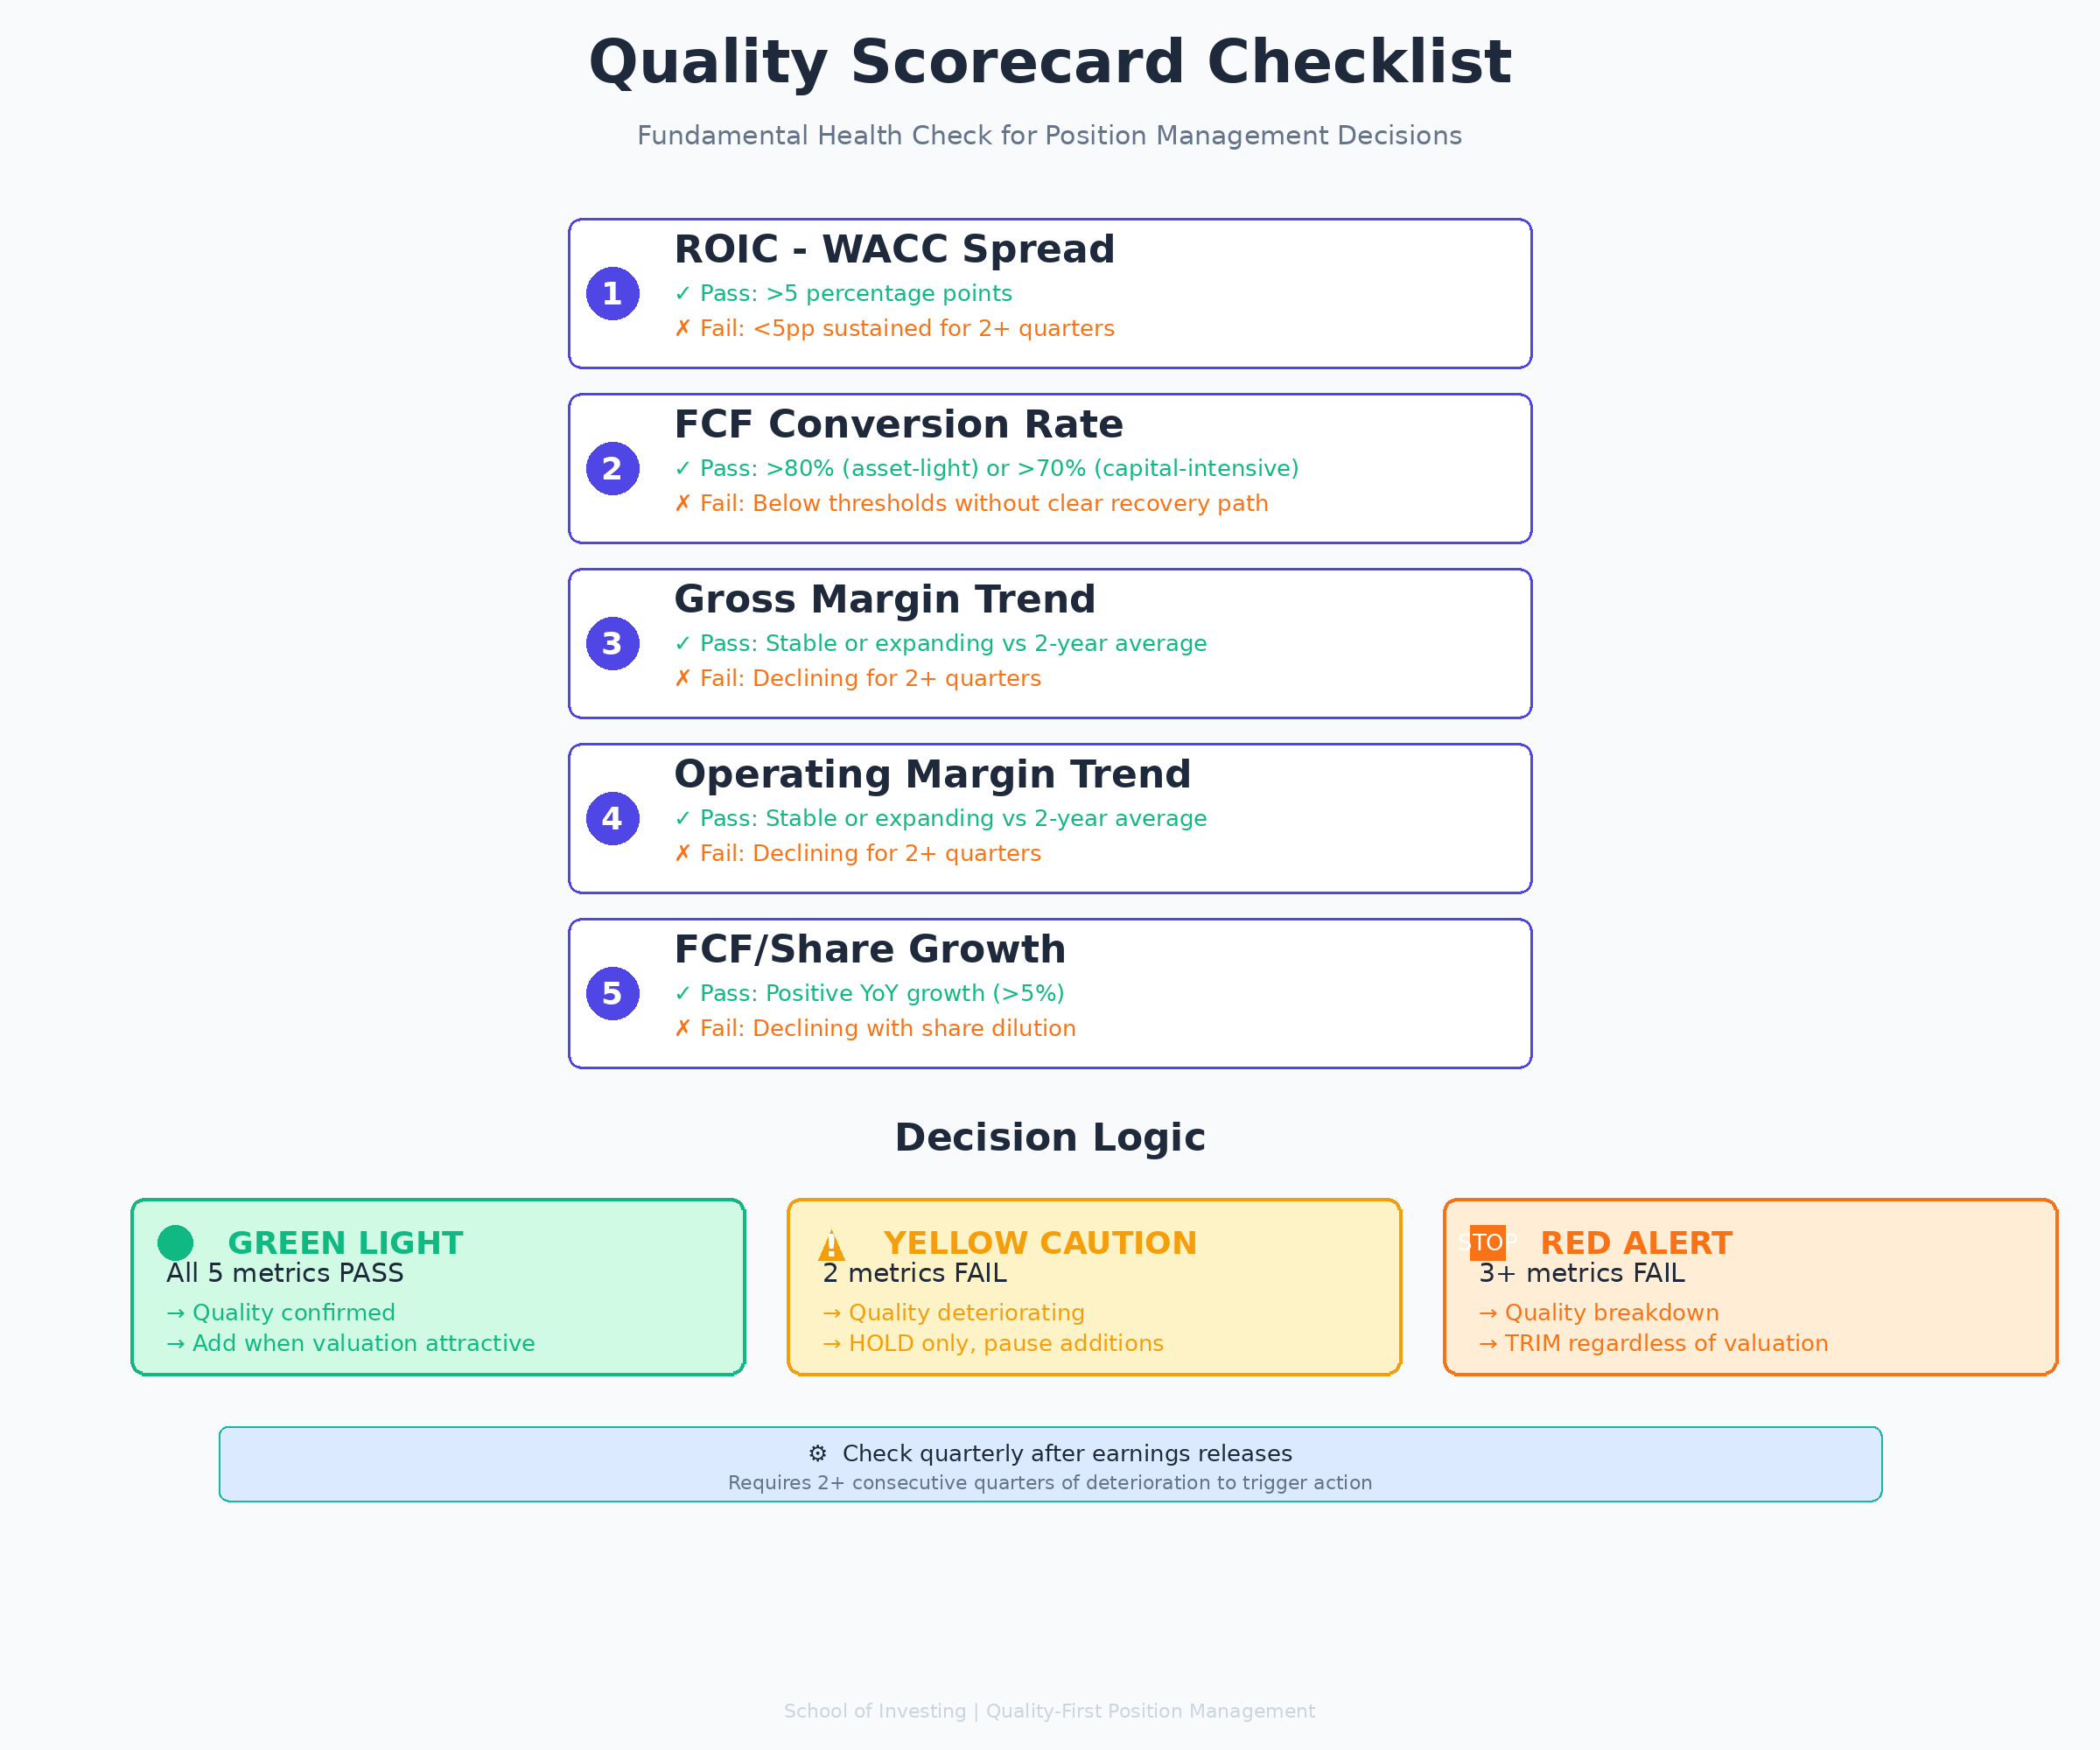
Quality Zone: Fundamental Health Check
Valuation alone misleads if quality deteriorates.
Monitor four metrics quarterly: (1) ROIC minus WACC spread, if it compresses below 5 percentage points, something broke (pricing power weakened, cost structure bloated, or capital intensity rising); (2) FCF conversion, calculated as FCF divided by net income, ideally stable at 90%+ for asset-light models or 70%+ for capital-intensive ones; (3) Gross and operating margin bands, expanding margins signal pricing power or scale benefits, while contracting margins (absent deliberate investment) flag competitive pressure; (4) Per-share FCF growth, this isolates economic progress from share count changes and financial engineering.
If quality metrics trend down for two consecutive quarters, pause additions even if valuation looks cheap. Falling knives cut. Conversely, stable or improving quality justifies holding through short-term volatility.
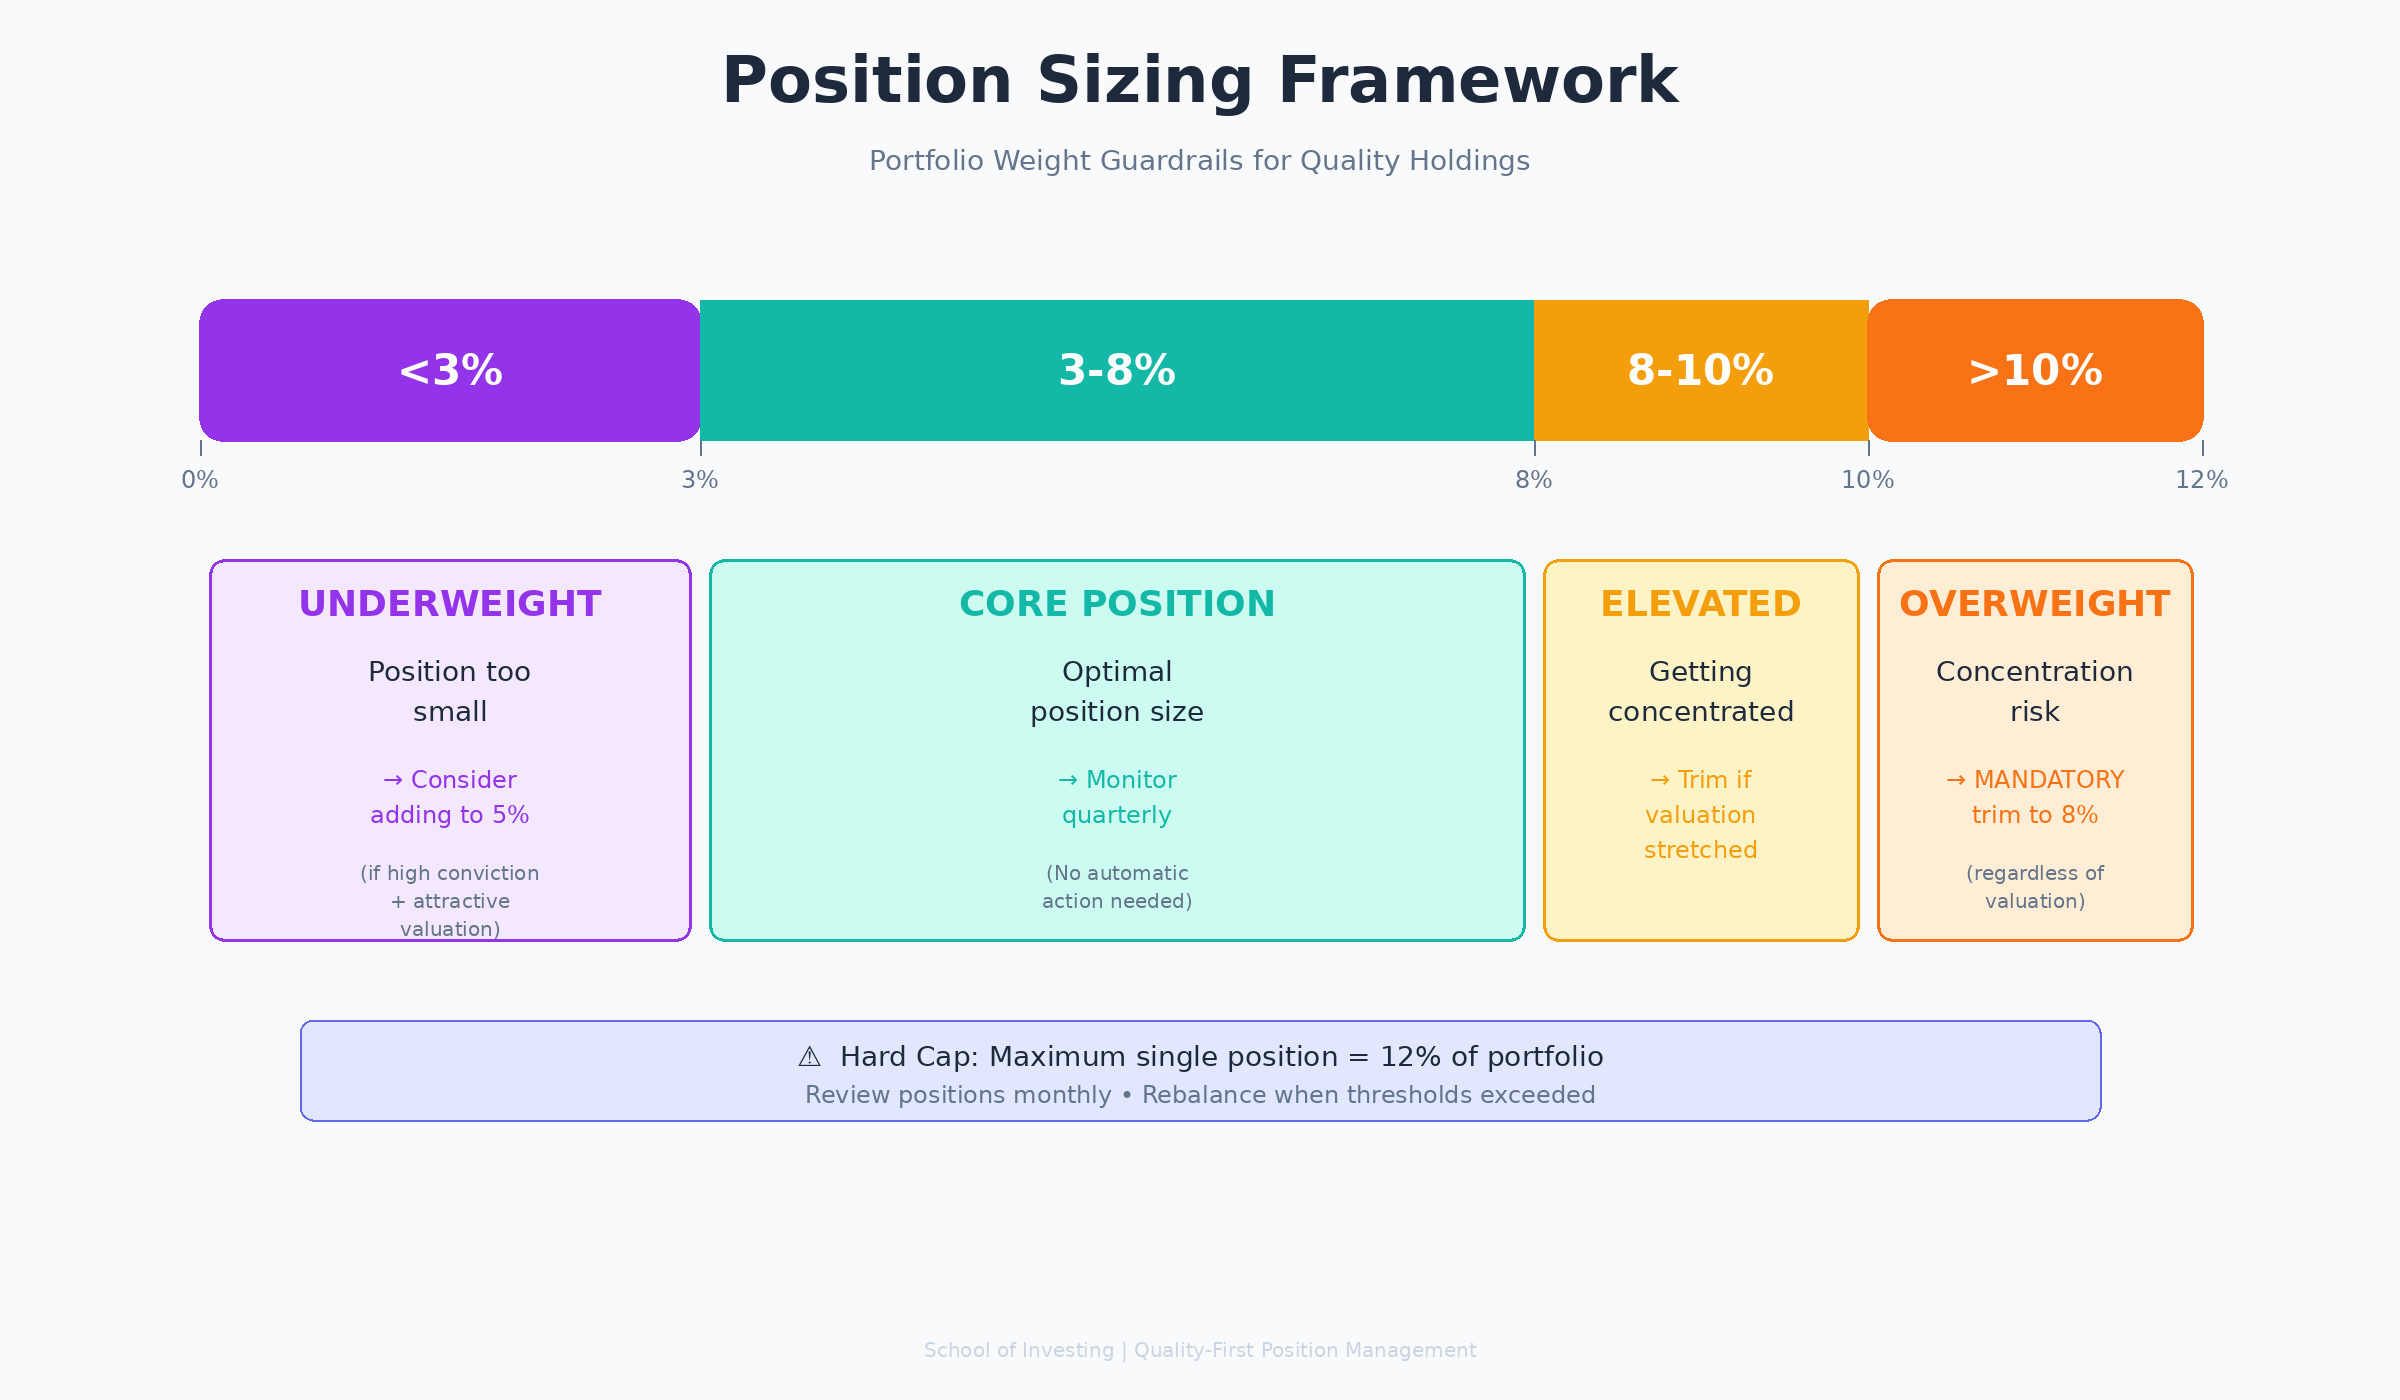
Position Sizing Zone: Portfolio Weight Guardrails
Even a perfect compounder at a fair valuation can become too large through appreciation. Set hard caps: no single position above 12% of portfolio value (concentration risk), and trim any position that exceeds 10% back to 8% (the “let winners run, but not forever” rule).
Conversely, if a high-conviction idea shrinks below 3% due to trimming or portfolio growth elsewhere, consider adding back to 5% to maintain meaningful exposure.
Interaction effects matter. A position at 11% weight trading at 50% above fair value triggers aggressive trimming (valuation + size risk). A 4% position at 40% below fair value with stable quality trends triggers aggressive adding (all three zones align).
Worked Example: ASML Holding (2019–2024)
ASML manufactures extreme ultraviolet (EUV) lithography systems, the machines that print the smallest, most advanced semiconductor chips. It holds a monopoly in EUV technology, supplying TSMC, Samsung, and Intel. This moat creates predictable pricing power and capital-light economics (for an equipment maker).
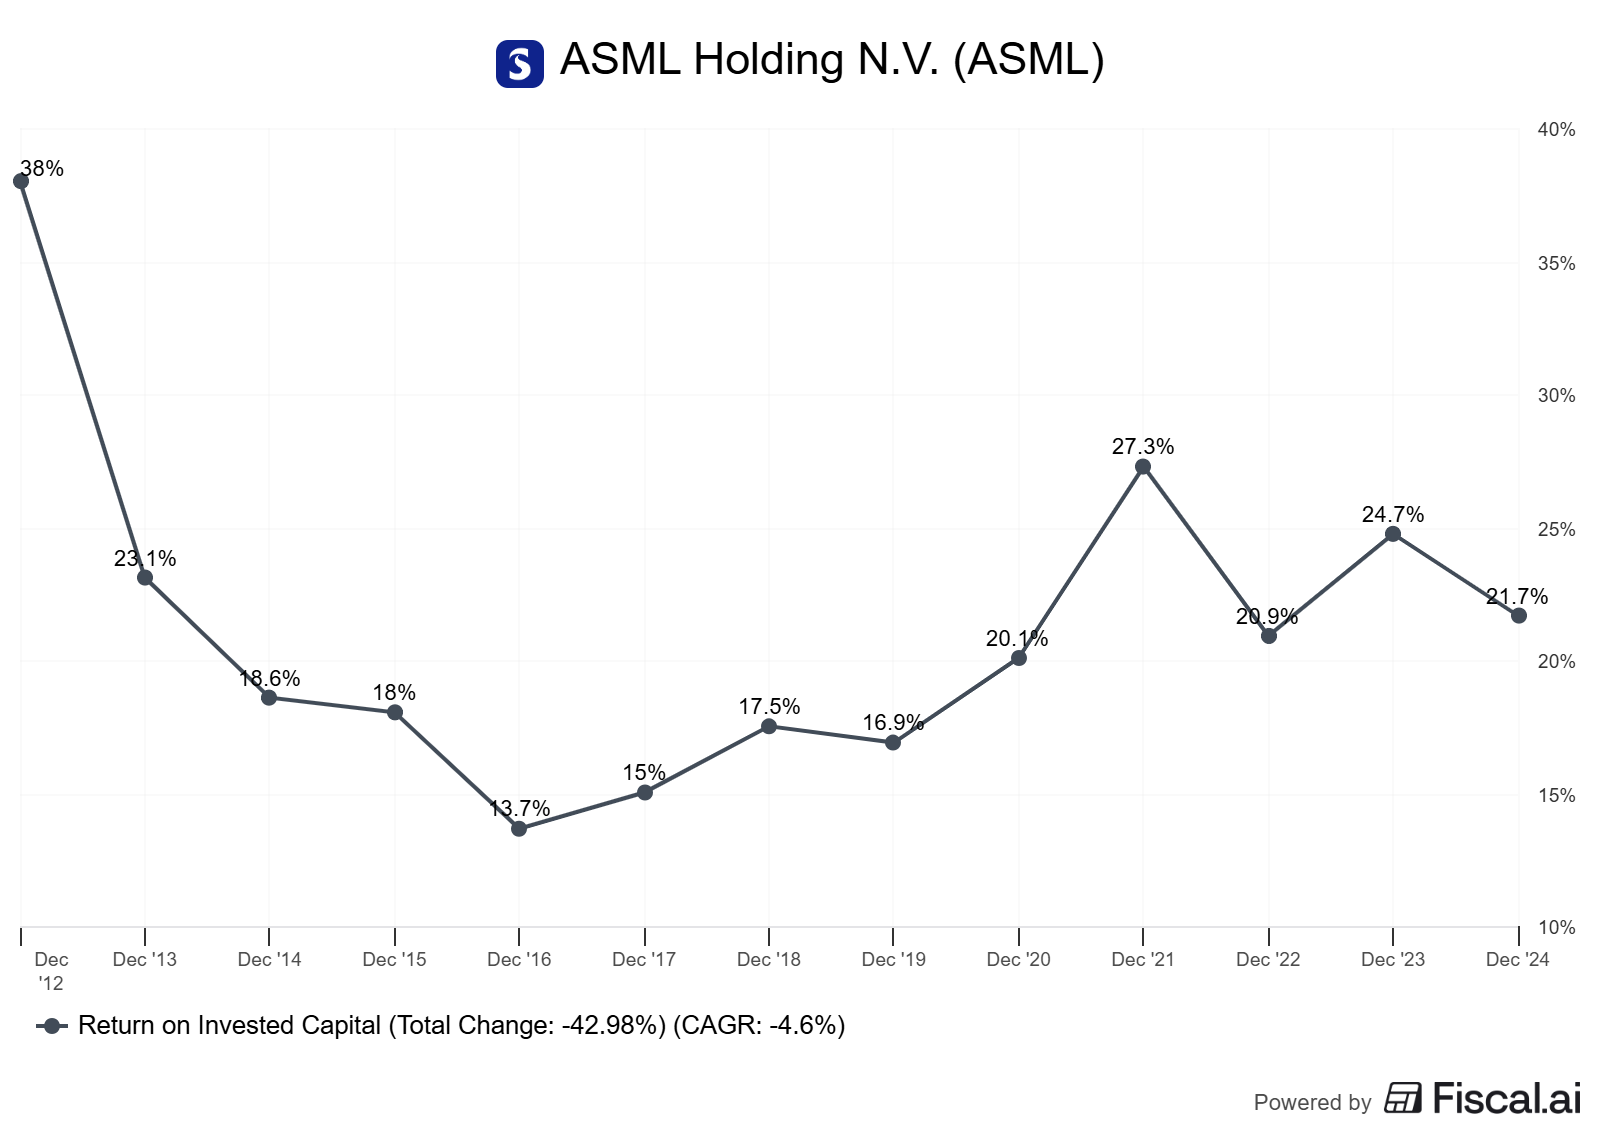
Quality trends (2019–2024): ASML’s ROIC averaged 28% from 2019–2023, consistently exceeding its estimated WACC of 8–9% by 19+ percentage points (data from ASML annual reports, as of December 2023).
Gross margins held steady at 51–54%, reflecting monopoly pricing on EUV systems priced at €150–200 million each. FCF conversion averaged 85% of net income, healthy for a business with lumpy CapEx tied to R&D facilities.
Per-share FCF grew from €9.50 in 2019 to €26.50 in 2023, a 29% CAGR, while share count stayed flat (modest buybacks offset stock-based compensation).
Evidence: The quality scorecard stayed green across all four metrics for five consecutive years. ROIC-WACC spread never dipped below 15 percentage points. Margin stability held despite temporary supply chain disruptions in 2020–2021. FCF/share growth compounded at nearly 3x the rate of revenue growth (9% revenue CAGR vs 29% FCF/share CAGR), showcasing operating leverage.
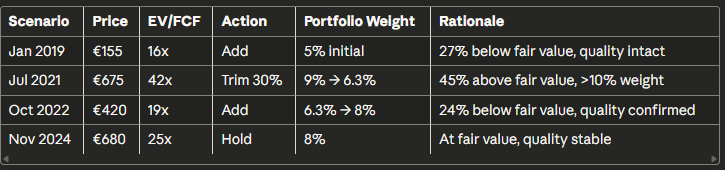
Valuation swings created decision points. In January 2019, ASML traded at €155/share, implying 16x forward FCF (based on 2019 estimate of €9.70/share). Fair value using a 22x multiple (justified by 25% ROIC and 15% growth) suggested €213/share, ASML was 27% undervalued.
Action: Add to build a 5% position.
By July 2021, shares hit €675, representing 42x trailing FCF (€16/share TTM). The 5-year median EV/FCF was 24x. At 42x, ASML traded 75% above the median and 45% above fair value (revised to €465 based on higher 2021 FCF).
Action: Trim 30% of the position (reducing from 9% to 6.3% weight), locking in 335% gains on the trimmed shares.
In October 2022, post-correction shares fell to €420, representing 19x forward FCF (€22 estimate for 2023). Fair value at that point: €550 (25x justified by improved profitability). ASML traded 24% below fair value.
Action: Add back, restoring position to 8%.
By November 2024, shares trade near €680 again (roughly 25x forward FCF on €27 estimate for 2025), in line with fair value.
Action: Hold, monitor quality trends quarterly.
Result: The systematic framework captured a 4.4x return from 2019–2024 vs a 2.9x buy-and-hold return, by trimming 30% near the peak and redeploying into the 2022 dip. It also maintained emotional discipline—rules removed the temptation to “ride it to zero” or sell too early.
Alternative interpretation: A pure buy-and-hold investor who never trimmed would argue the framework left gains on the table if ASML re-rates permanently to 30x+ due to AI-driven chip demand. Valid, but base rates suggest valuation mean reversion happens more often than permanent re-ratings. The framework sacrifices potential upside outliers to protect against downside median outcomes.
How to Build Your Own Trim/Hold/Add Rules
Step 1: Define intrinsic value. Gather trailing twelve-month (TTM) and forward FCF estimates from the company’s latest 10-K/20-F and investor presentation. Calculate FCF/share (FCF ÷ diluted shares outstanding). Apply a justified multiple based on ROIC and growth: use 20–25x for 20%+ ROIC businesses growing 10–15%, or 15–20x for 15–20% ROIC growing 5–10%. Cross-check against the stock’s 5-year median EV/FCF (available on FactSet, Bloomberg, or Fiscal.ai). Fair value = FCF/share × justified multiple.
Step 2: Set valuation bands. Calculate trim threshold at +40% above fair value and add threshold at -30% below fair value. These aren’t magic numbers—adjust based on volatility (wider bands for cyclicals, tighter for stable growers). Document the bands in a spreadsheet and update quarterly as FCF estimates change.
Step 3: Monitor quality metrics quarterly. Pull ROIC from the latest 10-Q/20-F (NOPAT ÷ invested capital). Compare to estimated WACC (use 7–9% for diversified industrials, 6–8% for tech, 8–10% for financials as starting points). Calculate FCF conversion (operating cash flow minus CapEx, divided by net income). Track gross and operating margins vs the prior 8 quarters. Confirm FCF/share grew vs the prior year (adjust for one-time items).
Decision rule: If ROIC-WACC spread falls below 5 percentage points for two quarters, or if FCF conversion drops below 70% without clear temporary causes (e.g., inventory build for growth), downgrade quality and pause additions even if valuation looks cheap.
Step 4: Apply position sizing guardrails. Calculate each position as a % of total portfolio value monthly. If any position exceeds 10%, trim enough to bring it back to 8% regardless of valuation (concentration risk trumps conviction). If a high-conviction idea shrinks below 3%, consider adding back to 5% when valuation is attractive.
Step 5: Execute mechanically. When a trim trigger fires, sell 25–30% of the position (not 100%—you want to stay invested in compounders). When an add trigger fires, allocate 1–2% of portfolio value. Rebalance quarterly unless extreme dislocations (>50% moves) demand faster action.
Common Pitfalls and False Positives
Pitfall 1: Confusing valuation compression with quality deterioration. A stock falling from 35x to 25x FCF while FCF/share grows 20% isn’t broken—it’s getting cheaper. Many investors panic-sell during multiple compressions, mistaking price declines for fundamental decay. Check the quality scorecard first. If ROIC, margins, and FCF conversion remain healthy, the drop represents an opportunity, not a disaster.
Pitfall 2: Anchoring to cost basis. “I bought it $50, and it’s now $150. I can’t add more because I’d be buying at 3x my cost.” This error ignores the current valuation. If the fair value is $200 and it trades at $150, the 3x return you already earned is irrelevant to the forward decision. Evaluate every add/trim based on current price vs current intrinsic value, not historical entry points.
Pitfall 3: Ignoring share count changes. Revenue and earnings growth can mask per-share dilution from excessive stock-based compensation or ill-timed equity raises. Always calculate FCF/share and EPS/share growth. If FCF grew 40% but share count grew 35%, owners captured only 5% of the gain. Dilution is a hidden wealth transfer from shareholders to employees or acquirers.
False positive: One-time FCF spikes. A company sells a division, books a $500M cash gain, and reports a blowout FCF quarter. Don’t recalculate fair value using inflated FCF; normalize for one-time items by averaging FCF over 4 quarters or using forward guidance. Otherwise, you’ll overpay for a temporary sugar high.
Pitfall 4: Overtrading on noise. Quarterly earnings volatility, short-term margin swings, or temporary supply chain hiccups shouldn’t trigger trim/add actions. The framework requires two consecutive quarters of deterioration to act, filtering out noise. Patience beats hyperactivity.
One-Page Checklist
Valuation: Current price vs fair value—trim if >40% above, add if >30% below, hold in between.
Quality: ROIC-WACC spread >5%, FCF conversion >80%, margins stable/expanding, FCF/share growing.
Position size: Cap at 10%, trim to 8% when exceeded; minimum 3% for high-conviction ideas.
Frequency: Review quarterly after earnings; act on extreme dislocations (>50% moves) intra-quarter.
Execution: Trim 25–30% when triggered; add 1–2% of portfolio when triggered; never 100% in or out.
Glossary
EV/FCF: Enterprise value divided by free cash flow; a valuation multiple showing how many years of FCF it takes to “pay back” the enterprise value.
FCF conversion: Free cash flow divided by net income, typically 70–100%; measures how much accounting profit turns into spendable cash.
ROIC: Return on invested capital; calculated as NOPAT (net operating profit after tax) divided by invested capital (equity + net debt).
Justified multiple: The valuation multiple (e.g., EV/FCF or P/E) a stock “deserves” based on its ROIC, growth rate, and reinvestment opportunities.
Fair value range: An estimated intrinsic value band, not a point estimate; typically ±20% around a base case to account for uncertainty.
Position sizing: The % of total portfolio value allocated to a single stock; caps and floors prevent over-concentration or under-exposure.
Trim: Selling 25–40% of a position to reduce exposure after valuation exceeds fair value; not a full exit.
Per-share metrics: Financial metrics divided by diluted share count (e.g., FCF/share, EPS/share); isolates economic progress from share count changes.
Further Reading
ASML 2023 Annual Report (filed February 2024) — Full financials, ROIC calculations, and capital allocation strategy.
Mauboussin on Position Sizing — Academic framework for position sizing in concentrated portfolios (2006).
O’Shaughnessy on Valuation Mean Reversion — Quantitative study of valuation cycles (2023 update).
Fiscal.ai — Interactive charting tool for ROIC, FCF trends, and valuation metrics.
References
ASML Holding N.V. Annual Report 2023 (filed February 15, 2024). Available at https://www.asml.com/en/investors/annual-report. Data as of December 31, 2023.
ASML Holding investor presentations (Q3 2024). Available at https://www.asml.com/en/investors/financial-results. Data as of September 30, 2024.
O’Shaughnessy Asset Management. “Valuation Matters: Mean Reversion in Equity Multiples.” Research paper (2023). Available at https://www.osam.com.
Michael J. Mauboussin. “Size Matters: Position Sizing and Portfolio Construction.” Legg Mason Capital Management white paper (2006). Available at Morgan Stanley Investment Management archives.
FactSet Research Systems. Historical valuation data for ASML (EV/FCF, P/E, EV/EBIT). Accessed November 2024.
Disclaimer: Educational content, not investment advice. Past performance does not guarantee future results. Consult a financial advisor before making investment decisions.
I also use a similar method, find a way to evaluate for expected value, watch it closely (either price or fundamentals can change it), arrange size accordingly, have enough of stocks to reduce overall risk and volatility.
Here is how I do that:
https://www.moatmind.com/p/using-irr-to-build-better-portfolios