
The Meta Capital Allocation Scorecard: A Practical Hierarchy for Deploying Free Cash Flow

Most investors debate buybacks versus dividends. Quality investors ask a different question: What’s the highest-return use of the next marginal dollar?
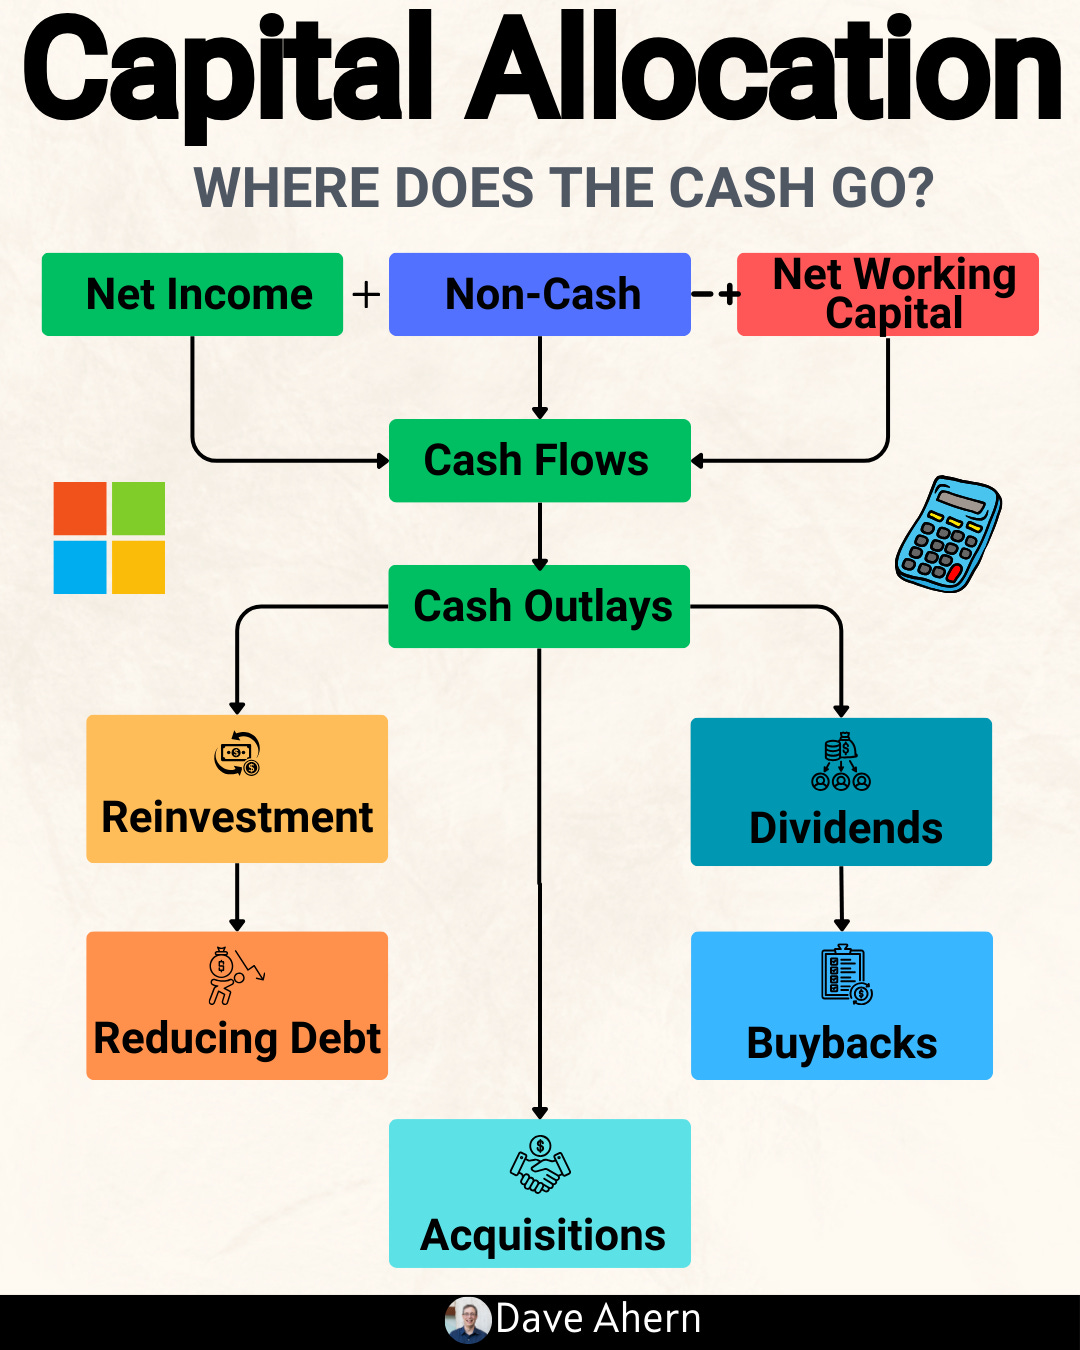
Today’s article gives you a visual, decision-first “Meta Capital Allocation Scorecard” that ranks uses of cash by their contribution to durable, per-share compounding—and shows you how to apply it to a real company.
TL;DR
Capital allocation should follow a hierarchy: high-ROIC organic reinvestment first; then disciplined bolt-ons; then buybacks when undervalued; then dividends; debt paydown is situational.
Always anchor on ROIC versus WACC. Sustained ROIC – WACC > 5% with reinvestment capacity is the core engine of value creation.
Per-share framing matters: track FCF/share, EPS, and share count. A shrinking share count at attractive valuations multiplies compounding.
Check FCF conversion and working capital discipline; cash pays bills, not GAAP earnings.
Use a scorecard to rank each dollar of cash across uses; update it annually with clear thresholds and hurdle rates.
Why it matters
Capital allocation is the CEO’s most repeatable edge. Over a decade, your return largely mirrors management’s ability to:
Earn returns above the cost of capital.
Reinvest at those attractive returns.
Return surplus cash intelligently when reinvestment is constrained.
Where investors go wrong:
Treating buybacks as universally good (they’re only good below intrinsic value).
Confusing growth with value creation (growth below WACC destroys value).
Ignoring per-share math (EPS/FCF per share vs absolute totals).
Overlooking working capital needs that drain cash despite reported profits.
Base rates to remember:
Most companies struggle to sustain ROIC materially above WACC; those that do often have identifiable moats and disciplined capital allocation.
Buybacks at peak multiples have historically underperformed; buybacks during periods of undervaluation add the most per-share value.
Capital-light, subscription-like models often show high cash conversion and stable moats—ideal habitats for quality compounding.
Core concepts (quality lens)
ROIC vs WACC and value creation
ROIC (return on invested capital) is the after-tax operating profit generated per dollar of capital invested.
WACC (weighted average cost of capital) is the blended cost of debt and equity capital.
Spread: ROIC – WACC. Positive and sustained spreads create value; negative spreads destroy it.
Light math:
ROIC ≈ NOPAT / Invested Capital
WACC ≈ (E/V)*Cost of Equity + (D/V)*After-tax Cost of Debt
Decision rule:
Prefer companies with ROIC – WACC > 5% sustained over a cycle, with reinvestment opportunities at similar or improving returns.
Reinvestment runway and capital intensity
Reinvestment runway: the capacity to deploy incremental capital at high returns for years.
Capital intensity: how much capital the business needs to grow (capex + working capital).
Signals of a long runway:
Large TAM with low penetration, pricing power, product breadth, and clear adjacencies.
Efficient capacity additions with attractive incremental returns.
Unit economics and per-share metrics
Unit economics: gross margin structure, customer acquisition cost (CAC), retention/churn, LTV/CAC where applicable.
Per-share framing: focus on FCF/share, EPS, and share count. SBC (stock-based comp) should be normalized into per-share economics.
Decision rules:
FCF conversion (FCF/Net Income) > 90% over a cycle is excellent for mature, capital-light businesses.
Progressive reduction in share count at or below intrinsic value is additive; rising share count via SBC requires higher growth to offset dilution.
Moat durability and evidence (not claims)
Evidence beats narrative: look for pricing power (stable or rising gross margin), retention (low churn, multi-year contracts), and switching costs (embedded workflows, data network effects).
Stability across cycles: margin bands that narrow or rise over time indicate durable moats.
The Meta Scorecard
This is the backbone of the article. Use it to rank each incremental dollar.
Organic reinvestment (highest priority)
R&D in core products; capacity expansion; go-to-market.
Hurdle: post-tax ROIC ≥ 1.3× WACC in steady state (e.g., ≥ 10% if WACC ~7–8%).
Bolt-on M&A (second)
Targets with strategic adjacency; integration competence; clear post-tax ROIC > WACC within 2–3 years.
Prefer small-to-mid deals with lower integration risk.
Buybacks (conditional)
Only when intrinsic value estimate ≥ market price margin-of-safety (e.g., ≥ 15%).
Funded from surplus FCF after reinvestment and balance sheet guardrails.
Dividends (progressive policy)
Grow with earnings power; avoid over-commitment that starves reinvestment.
Balance sheet (always-on guardrails)
Target net debt/EBITDA that protects flexibility (e.g., 1.5–2.0× for stable cash generators).
Maintain ample interest coverage.
Worked example: RELX plc
RELX is a global provider of information-based analytics and decision tools across scientific, legal, risk, and events. It’s a classic quality, capital-light compounder with subscription revenue and strong cash conversion.
What the numbers say (as of FY2023):
ROIC: 14.0% (adjusted definition in company materials) (RELX 2023 Annual Report, p. 2; as of FY2023).
Adjusted operating margin: 33.1% (up from 31.4% in 2022) (same source; as of FY2023).
Adjusted cash flow conversion: 98% (2023) (same source; as of FY2023).
Capital expenditure: ~5% of revenues (divulged in RELX reporting) (RELX 2023 Annual Report, as of FY2023).
Shareholder distributions: £800m buybacks in 2023; plan for £1,000m in 2024; dividend +8% to 58.8p (FT RNS/Results 2023, as of Feb 15, 2024).
Balance sheet: net debt/EBITDA ~2.0× (as of year-end 2023) (same FT RNS; as of FY2023).
Interpretation (quality lens):
ROIC > WACC by an estimated 6–7 pts suggests robust value creation.
High cash conversion supports both reinvestment and returns of capital.
Capital intensity is modest; incremental growth relies more on R&D and product expansion than on heavy capex.
Buybacks appear disciplined and consistent, layered on top of reinvestment and dividend growth.
Caveats:
“Adjusted” metrics differ from GAAP; investors should reconcile adjustments to understand normalized economics.
WACC is estimated; use your own inputs by region, rate environment, and beta.
Exhibitions segment has cyclicality; focus on blended margins and cash conversion across the cycle.
How to do this yourself
Step 1: Gather data (primary sources preferred)
Filings: Annual report/20-F, investor presentations, results releases (e.g., RELX 2023 Annual Report; FT RNS/Results 2023).
Financials: Revenue, operating profit, NOPAT, invested capital, capex, working capital, FCF, share count, SBC, buyback/dividend history, net debt/EBITDA.
Segment mix and qualitative moat drivers.
Step 2: Calculate core checks
ROIC: NOPAT / average invested capital over the period.
WACC: Use your inputs for risk-free rate, market risk premium, beta, and after-tax cost of debt.
FCF conversion: FCF / Net Income. Also track FCF margin: FCF / Revenue.
Per-share metrics: FCF/share, EPS, share count trend; adjust for SBC if material.
Working capital: DSO, DIO, DPO; compute CCC = DSO + DIO – DPO.
Step 3: Build the Meta Scorecard
For each use of cash, score 0–5 on:
Return vs hurdle (post-tax ROIC vs WACC).
Strategic fit/moat strengthening.
Timing/optionality (is this reversible?).
Balance sheet impact (leverage after action).
Valuation (for buybacks/M&A).
Rank by total score. The top-ranked use gets the next marginal dollar.
Step 4: Decision rules and thresholds
Organic reinvestment: greenlight if modeled post-tax ROIC ≥ 10–12% (assumes 7–8% WACC).
Bolt-on M&A: require credible path to post-tax ROIC > WACC by year 2–3; cap deal size to maintain ≤ 2.0× net debt/EBITDA for stable cash generators.
Buybacks: require ≥ 15% discount to intrinsic value (reverse DCF/owner earnings) and room under leverage guardrails.
Dividends: target a progressive policy covered by through-cycle FCF.
Balance sheet: set floor for interest coverage (e.g., > 8×) and ceiling for net debt/EBITDA (e.g., ≤ 2.0× for non-cyclical businesses).
Step 5: Monitor and update annually
Re-score uses of cash after earnings and at valuation inflection points.
Revisit hurdle rates when rates/credit spreads move materially.
Pitfalls and false positives
Buybacks at any price: Accretive only below intrinsic value. Buying back at peak multiples shrinks flexibility and destroys per-share value.
Growth-for-growth’s sake: Expanding capital employed at returns near WACC erodes value even if revenue grows.
Ignoring working capital: Rapid growth that lengthens DSO or builds inventory can crush FCF despite solid earnings.
Over-reliance on “adjusted” metrics: Always reconcile GAAP to adjusted numbers; understand recurring vs truly one-off items.
Dividend traps: Overcommitting to payouts in businesses with high reinvestment needs or cyclicality.
Checklist / one-pager
ROIC – WACC > 5% sustained? Yes/No
Reinvestment runway (3–5+ years) with stable/increasing margins? Yes/No
FCF conversion > 90% through-cycle? Yes/No
Per-share metrics trending up; share count stable/down; SBC < 5% revenue? Yes/No
Balance sheet within guardrails (Net debt/EBITDA ≤ 2.0×; high interest coverage)? Yes/No
Buybacks only below intrinsic value and after organic/M&A needs? Yes/No
Dividend covered by through-cycle FCF and flexible? Yes/No
M&A policy favors bolt-ons with clear, measured post-tax ROIC > WACC in 2–3 years? Yes/No
Mini-FAQ
How do I estimate WACC quickly?
Use a reasonable range: risk-free rate (10-year government), market risk premium, your beta estimate (sector/5-year), and after-tax cost of debt. Sensitize ±100–200 bps.
What if ROIC is high but reinvestment runway is short?
Prioritize buybacks (if undervalued) and dividends after fully funding high-return organic projects; avoid forced M&A to chase growth.
Are dividends ever superior to buybacks?
Yes—when the stock is fairly/over-valued and there’s no high-return reinvestment. Dividends avoid buying dear.
How do I judge buyback quality?
Check timing vs valuation, funding source (FCF vs debt), per-share outcome (EPS/FCF/share), and whether buybacks offset SBC or truly reduce share count.
What’s a good FCF conversion?
90%+ is excellent for capital-light models. Lower figures can be fine in capex-heavy growth years, but should normalize higher.
Glossary
ROIC: Return on invested capital; NOPAT divided by invested capital.
WACC: Weighted average cost of capital; blended cost of equity and debt.
FCF: Free cash flow; cash from operations minus capex (and sometimes plus/minus working capital).
FCF conversion: FCF divided by net income; a cash quality metric.
SBC: Stock-based compensation; a non-cash expense that dilutes shareholders if not offset.
CCC: Cash conversion cycle; days to convert inventory and receivables into cash, net of payables.
Bolt-on M&A: Small acquisitions adjacent to the core, easier to integrate.
Margin of safety: Discount between price and intrinsic value estimate.
Further reading
Measuring the Moat (Mauboussin) — durable competitive advantage, 2013.
Berkshire Hathaway Shareholder Letters — on capital allocation, ongoing.
Aswath Damodaran — Cost of capital and valuation notes, updated annually.
Credit Suisse (CSFB) — Global Investment Returns Yearbook (for base rates), annual.
References
RELX 2023 Annual Report (financial summary, ROIC 14.0%, adjusted cash flow conversion 98%, operating margin 33.1%, capex ~5% of revenue) — as of FY2023: RELX 2023 Annual Report.
RELX 2023 Results Announcement (buybacks £800m in 2023; plan £1,000m in 2024; dividend +8%; net debt/EBITDA 2.0×; M&A pace) — as of Feb 15, 2024: Financial Times RNS: RELX 2023 Results.
RELX press on publication of 2023 Annual Report — confirmation of filings — as of Feb 2024: RELX press release.
Disclaimer
Educational content, not investment advice.