
Subscription Software Showdown: A Quality Investor’s Guide to Valuing Adobe vs. Autodesk

Recurring revenue businesses, particularly dominant software platforms like Adobe and Autodesk, command a significant premium in public markets.
As investors, it’s not enough to pay the multiple; we must understand the fundamental drivers that justify that high price and, crucially, know where those assumptions break.
Today’s article will teach you how to translate core quality metrics—like Return on Invested Capital (ROIC) and Free Cash Flow (FCF) conversion—into a rigorous valuation framework, specifically using a reverse Discounted Cash Flow (DCF), to stress-test market expectations for these two recurring revenue giants.
TL;DR
The Valuation Challenge: High multiples in quality software stocks often embed aggressive, long-duration growth assumptions that must be rigorously tested.
Quality First: The premium is earned by sustained ROIC > WACC, which proves the company creates value with every dollar reinvested.
Reverse DCF is Key: Instead of forecasting, the reverse DCF backs out the market's already-priced-in revenue growth rate.
Per-Share Discipline: Focus on Free Cash Flow Per Share (FCF/share) to account for share count changes (like stock-based compensation and buybacks).
Adobe vs. Autodesk: We’ll apply this lens to these two iconic software companies, comparing the market’s implicit growth bets against their historical fundamentals.
Why It Matters (Context, Base Rates, Where Investors Go Wrong)
High-quality businesses with sticky, recurring revenue models are the holy grail for many investors.
Companies like Adobe (creative and document software) and Autodesk (design and engineering software) transitioned successfully from selling one-time licenses to a subscription model, creating powerful moats and extremely predictable cash flows.
This predictability gives them a much lower business risk profile.
The Base Rate Challenge: Investors face the challenge that the market rarely misses this quality.
The average S&P 500 company has a typical Enterprise Value (EV) to Free Cash Flow (FCF) multiple of around $15x to $20x. Dominant subscription software companies often trade at $30x, $40x, or even higher. When you pay $40 for one dollar of current FCF, you are making a massive long-term bet on growth and durability.
Most companies simply fail to maintain the blistering growth rate embedded in such a high multiple over the requisite decades.
Where Investors Go Wrong: Most investors stop at comparing multiples—Adobe is cheaper than X or more expensive than Y. Quality investing demands a deeper look.
We need to quantify the exact future performance the market expects. If a stock is priced to deliver 15% revenue growth over 10 years, and you think it can only deliver 12%, the stock is likely an avoid, regardless of its quality.
This is where the reverse DCF shines: it forces you to confront the market’s assumptions directly.
Core Concepts in Quality Valuation
A high valuation is justified only if the company can generate outsized returns on new capital for a long time. The entire recurring revenue valuation premium is built on a few core concepts.
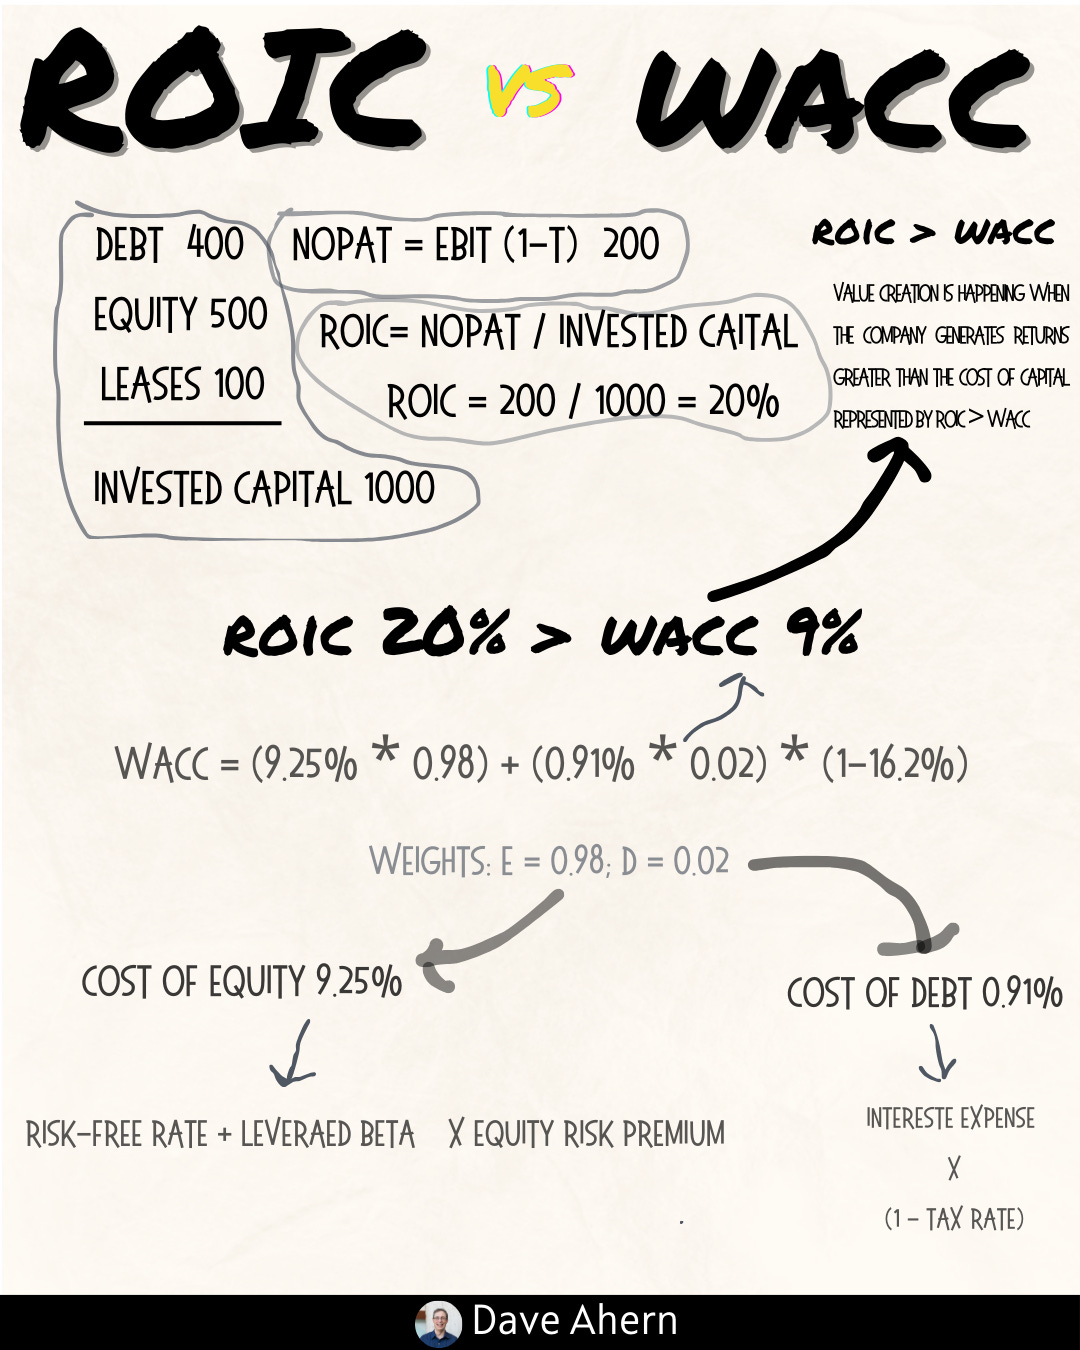
ROIC vs WACC and Value Creation
Return on Invested Capital (ROIC) is the most important metric for a quality investor. It measures the profit a company generates per dollar of capital invested in the business.
ROIC = Net Operating Profit After Tax (NOPAT) ÷ Invested Capital
The quality bar is ROIC > WACC.
WACC (Weighted Average Cost of Capital) is the required return for the company to break even for its financiers (debt and equity holders).
Value Creation: When ROIC > WACC (a positive spread), the company is creating wealth above its cost of financing. The larger and more durable the spread, the higher the business's fundamental value. Software companies, being capital-light, typically have very high ROIC—a key reason for their premium.
Reinvestment Runway and Capital Intensity
A high ROIC is great, but it’s useless without the ability to reinvest those profits. Reinvestment Runway refers to the duration and scale of high-return investment opportunities (e.g., R&D, sales expansion, M&A).
Capital Intensity refers to the amount of capital required to generate a dollar of revenue or profit. Software companies are generally low-capital-intensity—they don’t need large factories or extensive property, plant, and equipment (PP&E). This enables them to convert a high percentage of accounting profit (Net Income) into tangible cash profit (Free Cash Flow), which is then available for high-ROIC reinvestment or return to shareholders. A high FCF Conversion ratio (FCF ÷ Net Income) is a hallmark of a quality, capital-light business.
Unit Economics and Per-Share Metrics
For subscription businesses, unit economics relate to the profitability of an average customer. Key metrics like Net Revenue Retention (NRR)—which measures existing customer spending growth (including upsells and net of churn)—must be sustainably above 100% for high-growth software.
Furthermore, a quality investor must always use a per-share framing. Management might report strong Net Income growth, but if they issue excessive Stock-Based Compensation (SBC) without corresponding share repurchases, the per-share growth for existing owners is diluted. You must always track FCF per Share and EPS per Share alongside the raw company-level figures.
Moat Durability and Evidence (Not Claims)
A moat is a structural competitive advantage that protects a company’s high ROIC from competition. For companies like Adobe and Autodesk, the primary moats are:
Switching Costs: An architect trained on AutoCAD for two decades is unlikely to switch due to high time, data, and training costs.
Network Effects: Creative professionals using Adobe’s Creative Cloud often require others in their ecosystem to do the same for seamless collaboration.
Evidence: A quality investor looks not at management claims but at tangible evidence such as consistently high NRR, stable margins (especially Gross Margin), and a sustained ROIC-WACC spread over 10 years.
Valuation Frameworks, Drivers, and Scenario Design (Valuation Focus)
For a dominant, mature software company with recurring revenue, standard multiples like Price-to-Earnings (P/E) or EV/EBITDA can be misleading due to varying capital structures and non-cash items. FCF is a cleaner measure of true owner earnings.
We prefer an Enterprise Value to Free Cash Flow (EV/FCF) multiple for quick comparison, but the real work is in the reverse DCF.
The Reverse DCF:
Start with the Market Cap (Value) and the Cash Flows (FCF).
Use a defensible discount rate (WACC).
Calculate the implicit growth rate ($g$)—the growth rate the market must be assuming to justify the current stock price.
Scenario Design: Quality investors use scenarios to test the durability of growth. Instead of a single point estimate, we design three cases:
Bull Case: Assumes maximum reinvestment opportunity and sustained high NRR.
Base Case (Market Implied): The result of our reverse DCF; what we must believe.
Bear Case: Assumes margin compression, moderate growth, and eventual mean-reversion of ROIC.
Worked Example: Adobe ($ADBE) and Autodesk ($ADSK)
Adobe and Autodesk are both US-based, recurring-revenue software incumbents. Adobe dominates the creative and document markets (Creative Cloud, Document Cloud, Experience Cloud). Autodesk is the standard for computer-aided design, engineering, and construction (AutoCAD, Fusion 360). Both successfully navigated the license-to-subscription transition, making them excellent test cases for a quality valuation.
Data Snapshot (FY 2024 Endings - Adobe: Nov 2024, Autodesk: Jan 2024)
Data compiled from company 10-K and 8-K filings, Q4 2024 earnings materials, and market data as of October 2025.
Evidence: Operating Margin and FCF Conversion
Adobe has consistently exhibited higher gross and operating margins, reflecting its dominant, non-substitutable products in the creative suite (Photoshop, Illustrator). Autodesk, while dominant in its own niche, operates in a slightly more fragmented market.
FCF Conversion: Autodesk shows an exceptionally high FCF conversion ratio (~ 205% in FY24). This isn’t magic; it is largely due to its significant deferred revenue balance (customer cash collected upfront for a service delivered later), which flows directly into cash from operations but is not recognized in Net Income until the service is delivered.
This cash flow benefit is a quality hallmark of the subscription model.
Caveats and Alternative Interpretations: The primary caveat for both companies is the growing threat of Generative AI and the risk of commoditization. Will AI tools erode Adobe’s margins or pricing power? Will open-source or AI-powered design tools threaten AutoCAD’s lock-in? The market multiple may already reflect this risk, or it may be completely underestimating it. The valuation challenge lies in modeling the durability of their moats against this technological disruption.
How to Do This Yourself (The Reverse DCF)
The reverse DCF is the essential tool for sanity-checking a high-multiple stock. We will use it on Adobe ($ADBE), assuming current market values as of October 2025.
Data to Gather and Checks
Current Enterprise Value (EV): Market Cap + Total Debt – Cash & Equivalents. (Easily found on financial data providers).
Owner Earnings (FCF): Calculate FCF = Operating Cash Flow – Capital Expenditures (CapEx). For software, CapEx is typically low, but includes necessary software/hardware development costs where clear.
WACC (Discount Rate): This is your required return. A common, defensible estimate for a high-quality, large-cap US company is $\mathbf{8\% \text{ to } 9\%}$. We will use $\mathbf{8.5\%}$ as our WACC.
Exact Checks/Calculations: The Reverse DCF Setup
We will solve for the implied Revenue Growth Rate (implied) for a 10-year forecast period, maintaining a constant FCF Margin and using a reasonable terminal growth rate.
Assumptions (For the Reverse DCF on Adobe):
Starting FCF (FY24): ~$8.06}$ Billion [Source: Adobe FY24 Earnings Release, as of Dec 2024]
EV (Oct 2025): ~$200 Billion
WACC: 8.5%
FCF Margin (Stable): 37.5%
Terminal Value Growth (long-term): 3.0% (conservative, below global GDP)
The Iteration: By iteratively running a DCF model, we find the growth rate that makes the present value of all future cash flows equal to the current EV.
Result: To justify its current ~$200 Billion EV, Adobe must deliver an average 12.5% Free Cash Flow (and, by extension, Revenue) growth rate for the next 10 years, then grow at 3.0% forever after.
Decision Rules and Thresholds
The Go/No-Go Question: Is a sustained 12.5% FCF growth rate for 10 years a reasonable expectation for a $21.5 Billion revenue company?
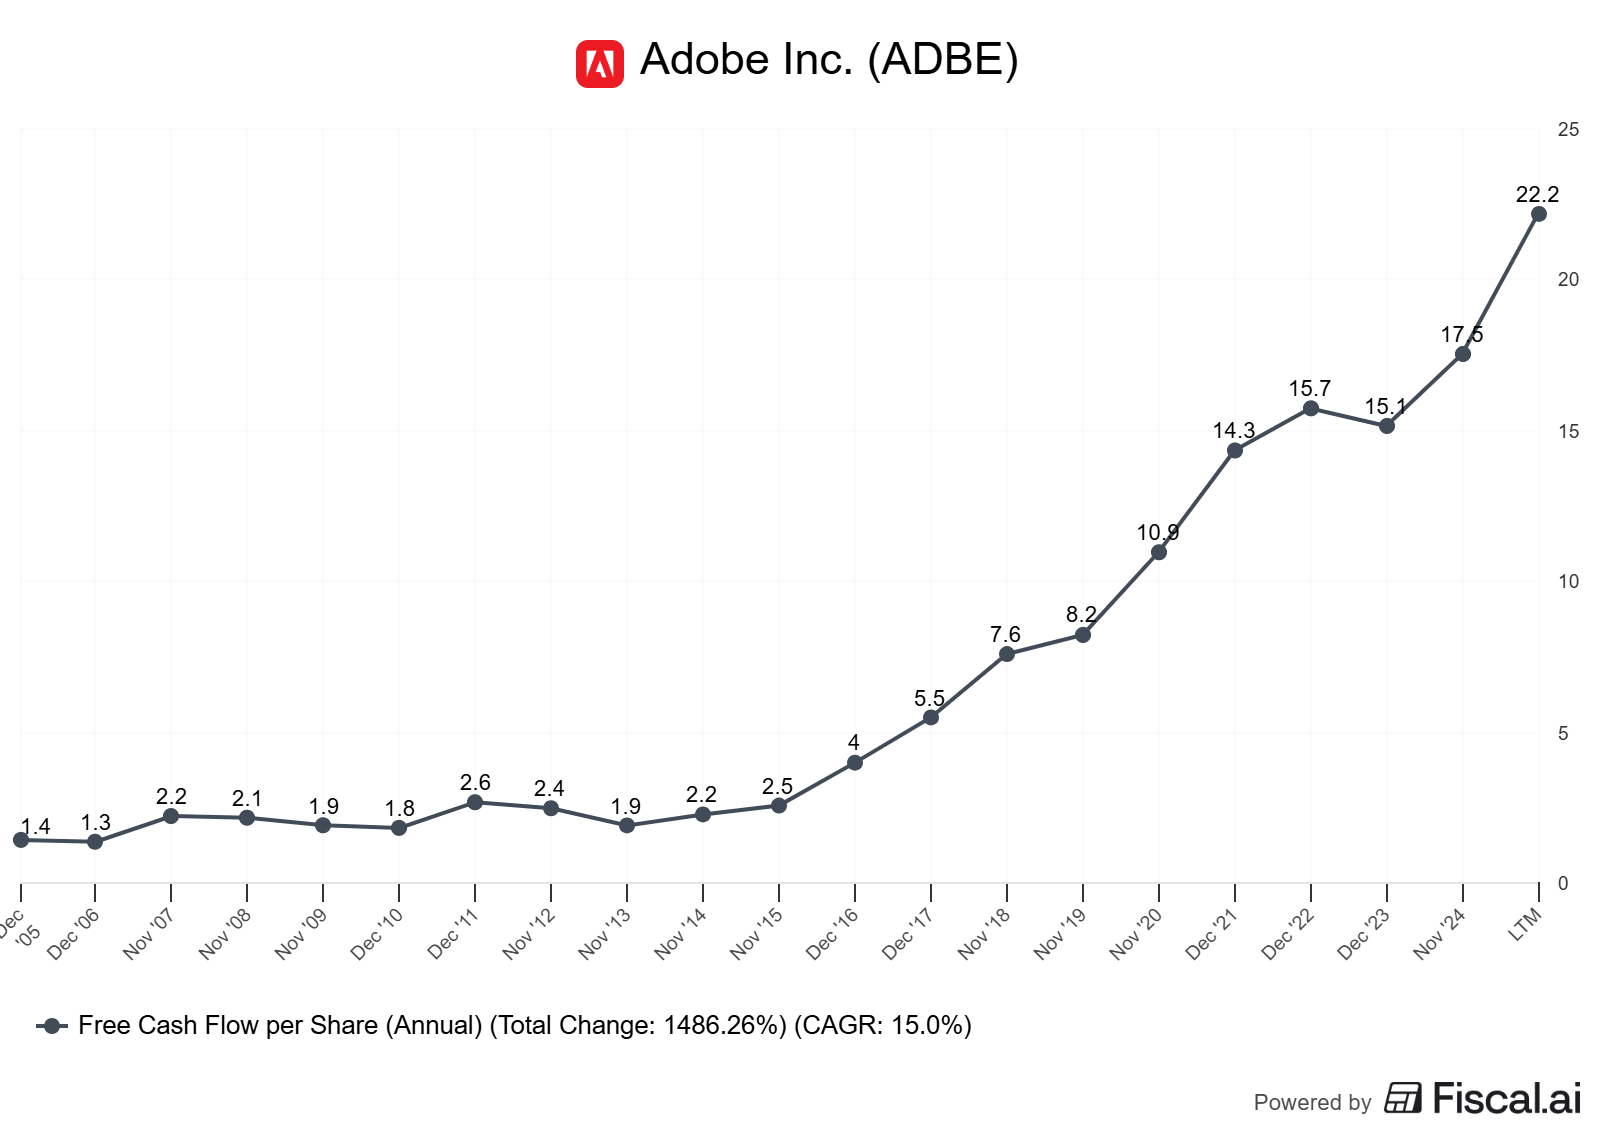
Adobe’s 5Y FCF/Share Growth:
~15.0%Conclusion: The market’s expectation (12.5%) is slightly below recent historical performance (15.0%). The price is aggressive but not impossible, and it likely reflects a slowdown in the current technological risk.
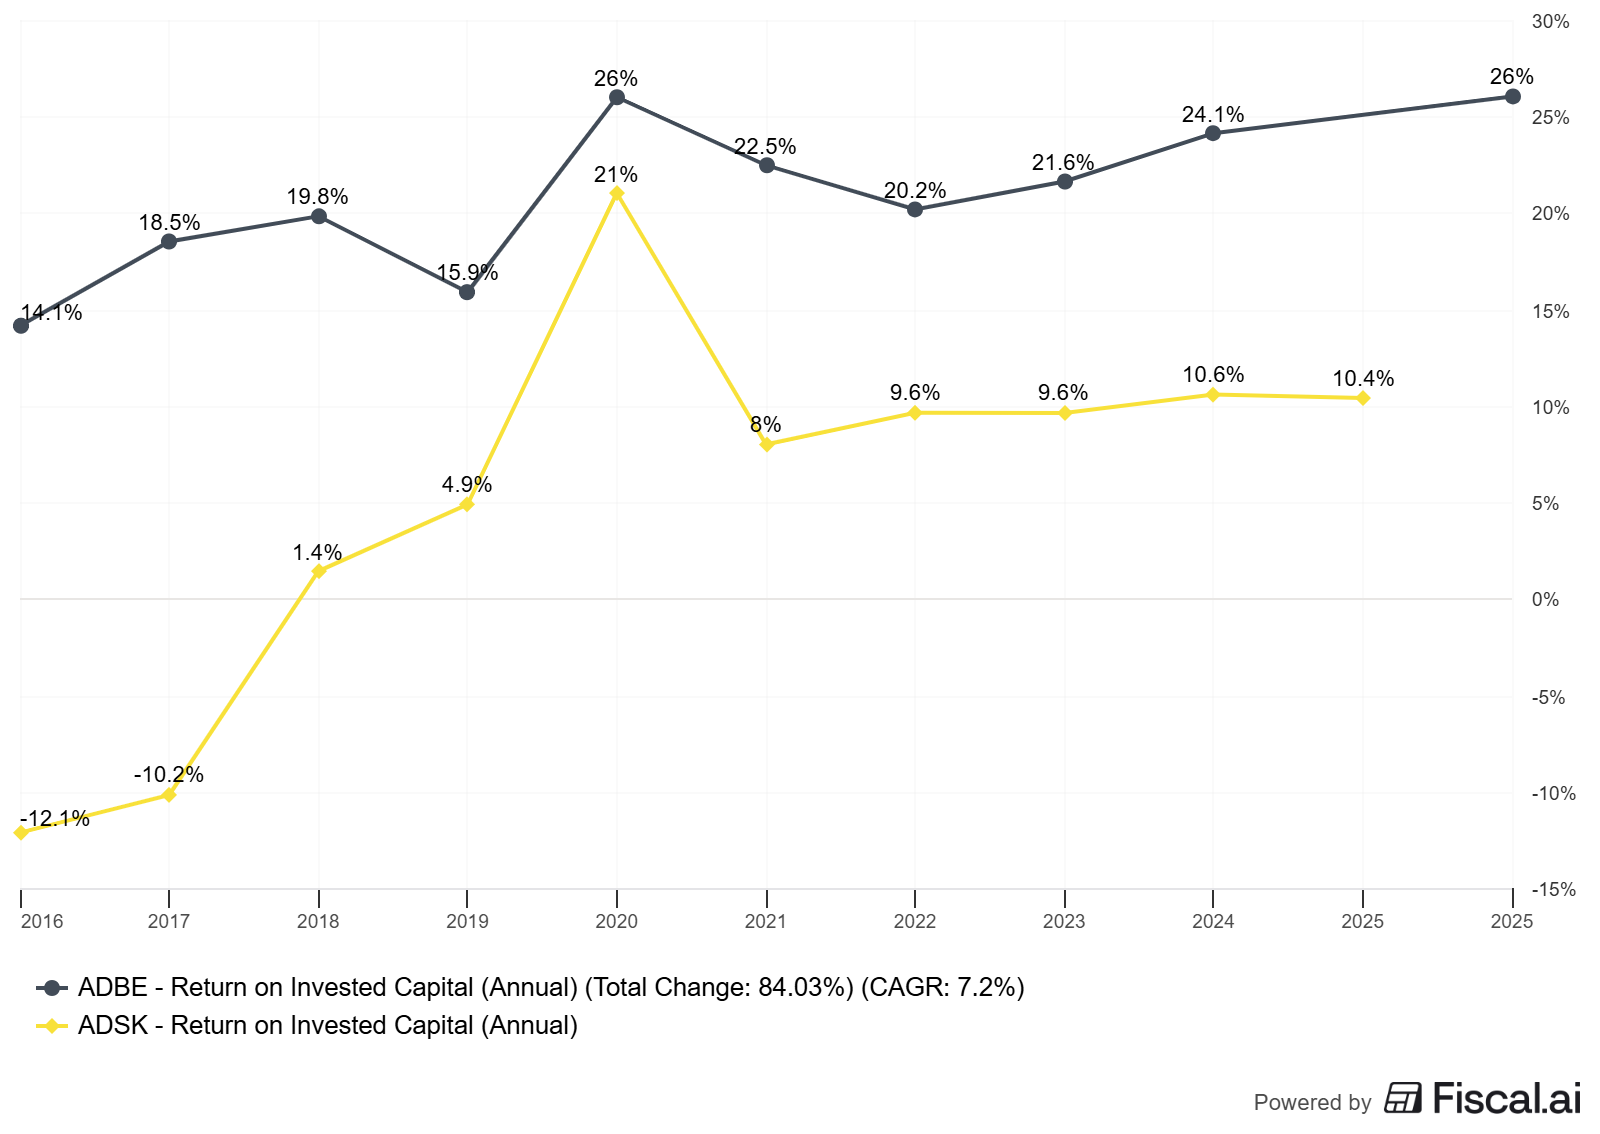
Decision Rule 1 (ROIC Spread): Prefer companies with a sustained ROIC - WACC > 10%. Adobe and Autodesk both meet this high bar, justifying a premium.
Decision Rule 2 (Reinvestment): FCF Conversion must be consistently >100% and CapEx must remain low (CapEx / Revenue < 5%). Both companies exceed this, proving capital efficiency.
Decision Rule 3 (Valuation Margin of Safety): Look for an implied growth rate that is at least 2% below your most conservative estimate for the company’s long-term growth. Since our bear case (9.0%) is significantly below the market’s $12.5%, there’s no inherent margin of safety at the current price—you must believe in the base case.
Pitfalls and False Positives
1. The “Non-Cash” Trap (Stock-Based Compensation): SBC is often touted as a non-cash expense that can be ignored. This is a crucial mistake for a quality investor. SBC is an economic expense and a cash drain—it causes dilution, which is like a hidden tax on existing shareholders. If management repurchases shares to offset dilution, that requires real cash from the FCF we are valuing. Always treat SBC as an economic expense.
2. Mistaking Deferred Revenue for a Moat: Deferred revenue (cash collected upfront) is a great sign of stickiness and predictability, but it’s an accounting timing benefit for FCF conversion, not a true competitive moat. The moat is what drives customers to pay upfront (e.g., high switching costs or a superior product).
3. Terminal Value Over-Reliance: In the DCF, the Terminal Value (the value of the company after the explicit forecast period) can account for 60% to 80% of the total present value. This is why the Terminal Growth Rate (g) and the final year’s FCF assumptions are so crucial. Small changes here have a massive impact. Quality investing aims to find companies with durable moats that justify a higher-than-average terminal growth rate (e.g., 3.0% instead of 2.0%).
Checklist / One-Pager
Quality Check: Is ROIC - WACC > 10% over the last 5 years?
Cash Flow Check: Is FCF Conversion (FCF/Net Income) consistently > 100%?
Growth Driver Check: Is Net Revenue Retention (NRR) sustainably > 110%?
Owner’s Check: Is FCF share growth outpacing raw FCF growth?
Valuation Check: Is the market’s implied growth rate from a reverse DCF below my most conservative 10-year forecast?
Glossary
ROIC (Return on Invested Capital): Profitability relative to the capital required to run the business.
WACC (Weighted Average Cost of Capital): The minimum return a company must earn on its existing asset base to satisfy its investors.
Free Cash Flow (FCF): The cash a company generates after covering its operating expenses and capital expenditures.
Reverse DCF: A valuation method that solves for the growth rate implied by the current market price.
Reinvestment Runway: The duration and magnitude of high-return investment opportunities available to a company.
FCF Conversion: The ratio of Free Cash Flow to Net Income (FCF / Net Income); a high ratio indicates capital efficiency.
Stock-Based Compensation (SBC): A non-cash expense that is a real economic cost due to its dilutive effect on per-share metrics.
Net Revenue Retention (NRR): The percentage of revenue retained from existing customers over a period, including upsells and net of churn.
Further Reading
The Outsiders by William Thorndike (on exceptional capital allocation).
Value: The Four Cornerstones of Corporate Finance by McKinsey & Company (detailed ROIC and valuation insights).
Michael Mauboussin on Moats and Competitive Advantage (various papers).
References
Adobe Inc. Annual Report on Form 10-K for Fiscal Year 2024 (as of Nov 2024).
Autodesk, Inc. Annual Report on Form 10-K for Fiscal Year 2024 (as of Jan 2024).
Bloomberg Terminal and Financial Data Providers (for market metrics like $\text{EV}$ and share price, as of Oct 2025).
McKinsey & Company, “Value: The Four Cornerstones of Corporate Finance,” 2020.
Educational content, not investment advice.
niche topic. learned something new. ty.