
Seeing Through GAAP: Why Capitalizing R&D Changes the Story for Cadence and Synopsys

If you expense every dollar of R&D, you may be systematically underestimating the true earnings power of software-like, innovation-led businesses.
In quality investing, that misread bleeds into ROIC, valuation, and capital allocation calls. Today, we’ll build a clean R&D capitalization lens and show how it reshapes the economic picture for Cadence and Synopsys.
TL;DR
R&D behaves like growth capex in many software/EDA companies; expensing it distorts operating income and ROIC.
“Capitalizing R&D” analytically means moving some R&D from period expense to an intangible asset amortized over a reasonable life.
This adjustment can boost adjusted EBIT, NOPAT, and ROIC—without changing cash—clarifying quality and reinvestment discipline.
Cadence and Synopsys generally expense R&D under GAAP; their filings also reference amortizable intangibles and some capitalized software/internals.
Use consistent amortization lives (e.g., 3–5 years), sanity-check them against product cycles, and pressure-test them with per-share and FCF conversion.
Why it matters
Quality investing seeks durable value creation: ROIC above WACC, supported by reinvestment runways and sound capital allocation. When large, recurring R&D is expensed, GAAP optics can penalize firms that continually invest in product and platform strength. That makes long-duration, moat-building businesses look “worse” than they are on earnings-based metrics—even if cash generation is healthy.
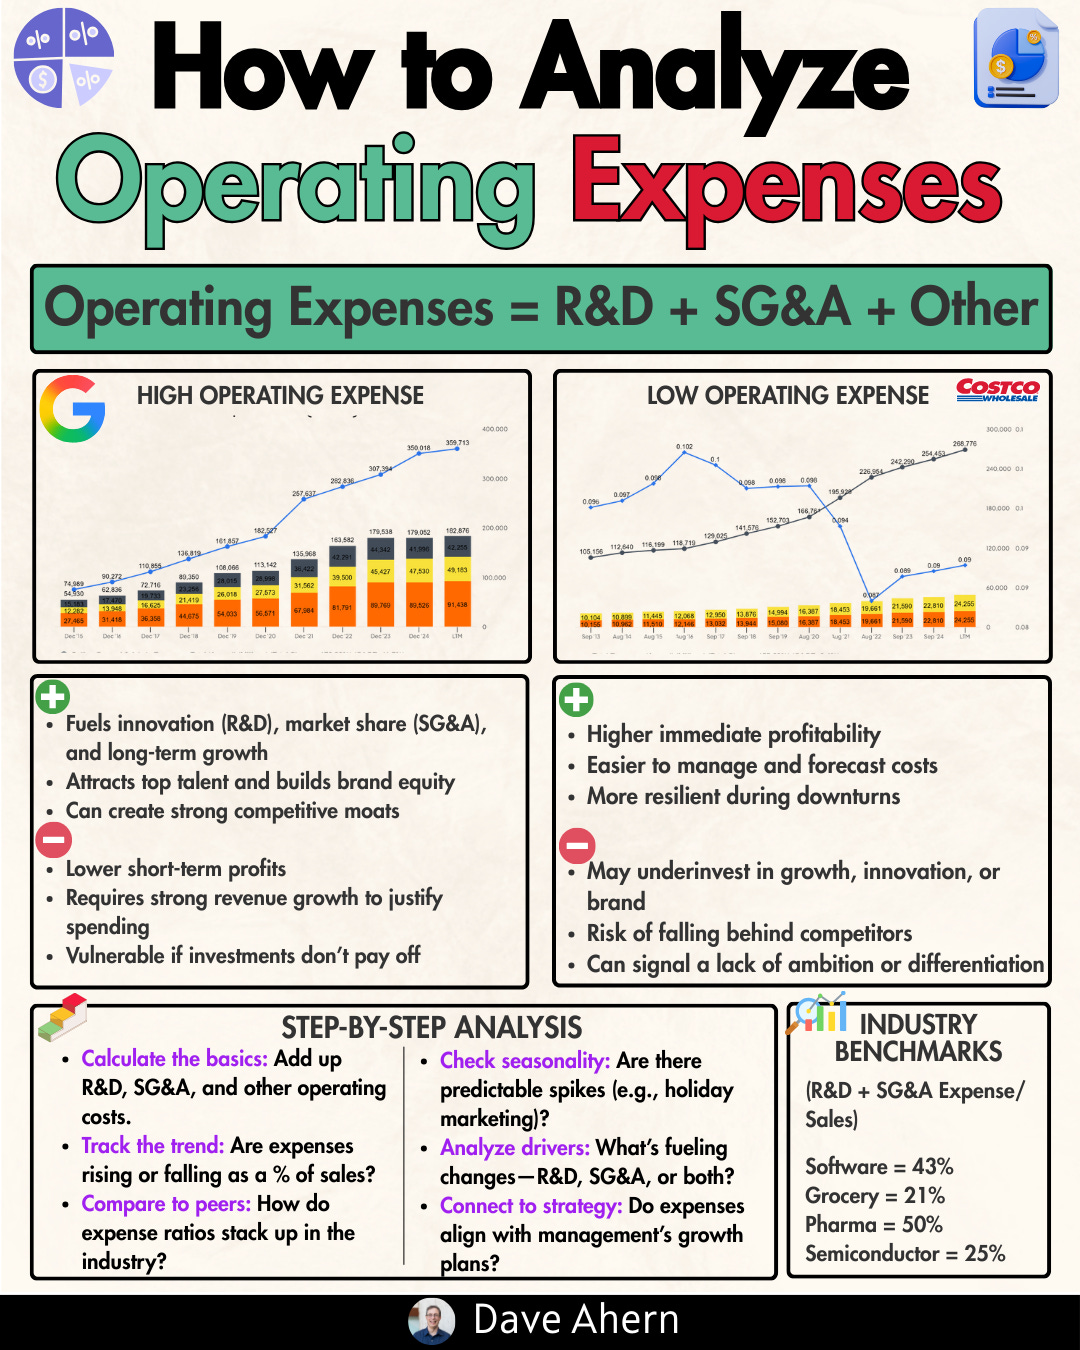
Base rates in software-like models: R&D intensity is often 15–30% of revenue for leading design and developer tooling franchises. Treating that as a period expense can depress EBIT margins and ROIC just when a company is deepening its moat through innovation. An analytical R&D capitalization can restore comparability across firms with differing accounting choices and life-cycle stages.
Where investors go wrong: They compare GAAP ROIC for high-R&D innovators to capital-light compounders that spend more on sales and marketing (S&M) than on research and development (R&D), or to businesses that capitalize a portion of their development spend. Apples-to-apples comparisons require normalizing for intangible investments and product cycle life.
Core concepts (quality-investing angle)
ROIC vs WACC and value creation
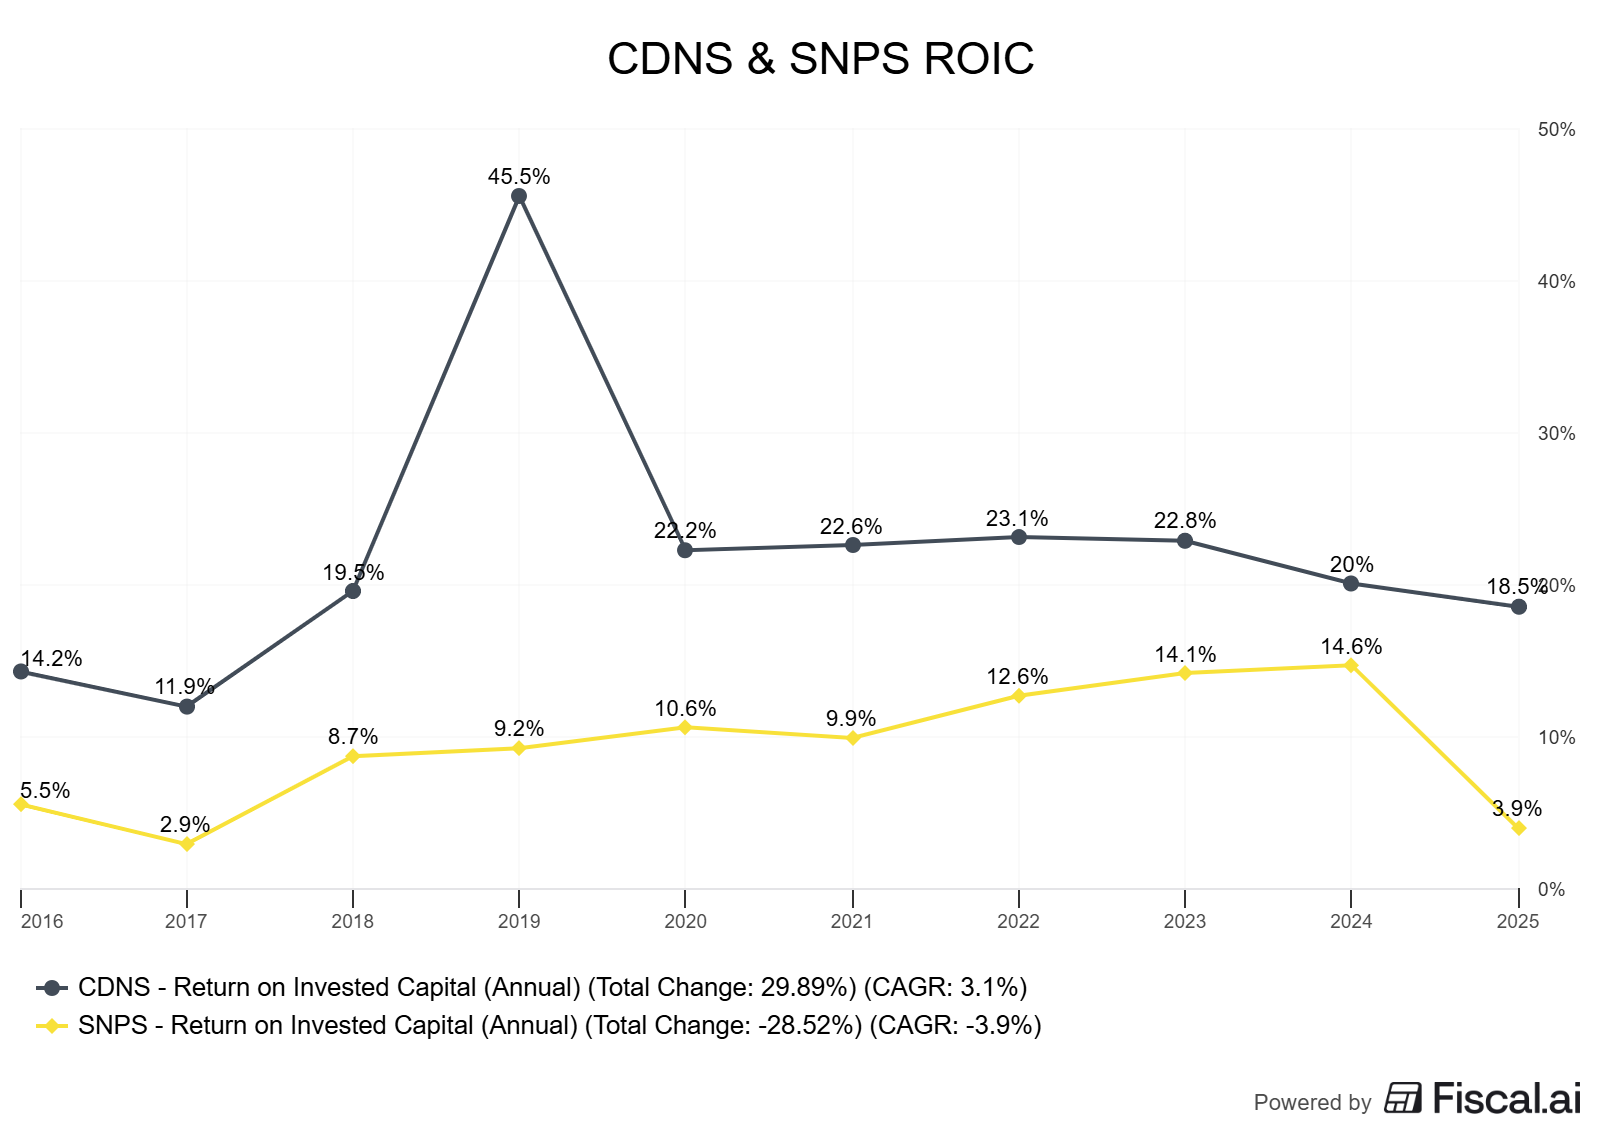
Concept: Economic value is created when ROIC exceeds WACC. ROIC is sensitive to what you count as “invested capital.” If R&D is purely expensed, invested capital appears smaller, and NOPAT appears smaller; ROIC can become noisy or misleading.
Evidence: EDA leaders report significant R&D and amortizable intangibles (from acquisitions) and, in Synopsys’ case, “capitalized software development costs” tags within filings, reinforcing that some software-related expenditures are amortized rather than expensed in certain contexts (Synopsys 2024 10-K XBRL, as of 2025-10-15).
Result: Analytical R&D capitalization (explained below) typically enhances adjusted operating profit and increases invested capital, often raising adjusted ROIC for innovation-led firms—improving quality signals if the WACC remains unchanged.
Reinvestment runway and capital intensity
Concept: A company’s runway is shaped by the returns on new “projects” (features, products, adjacencies) and the cost of sustaining them. For EDA, product roadmaps are multi-year and tightly linked to process nodes and customer design cycles.
Evidence: Cadence and Synopsys emphasize platform breadth, IP portfolios, verification/emulation hardware, and design automation leadership. These involve ongoing, multi-year development programs supported by M&A, which create amortizable intangibles and sometimes internal-use or other capitalized costs (see CDNS 10-Ks and SNPS 10-Ks in references).
Result: Viewing high R&D as economic investment aligns with the reality that product capability sets drive renewals, pricing power, and long-term retention.
Unit economics and per-share metrics
Concept: Even if GAAP earnings are dampened by expensed R&D, strong unit economics show up in consistent gross margin, maintenance/recurring mix, upsell, and high FCF conversion over cycles. Per-share framing matters—buybacks vs. dilution from SBC.
Result: Check FCF/share, EPS/share, and basic share count trajectory; tie SBC to durable value creation, not just headcount growth.
Moat durability and evidence (not claims)
Concept: Durable moats emerge in stable or improving margin bands, characterized by low churn, entrenched workflows, and premium renewals. In EDA, switching costs and ecosystem integration are high.
Evidence: A decade-long view of ROIC/WACC spreads, FCF margins, and recurring mix provides better proof than narrative alone.
Mode-specific focus: Case/Accounting Saturday
GAAP vs. economics: GAAP typically expenses R&D and amortizes acquired intangibles. Analytical R&D capitalization involves allocating a portion of R&D expenses to an “intangible asset” that is amortized over its economic life (e.g., 3–5 years), thereby increasing adjusted EBIT and invested capital.
Bridge: GAAP NOPAT → Owner earnings involve adjusting for R&D capitalization, stock-based compensation (SBC) view, and maintenance vs. growth portions of spend.
Worked example or mini case (mid-cap+; US or international)
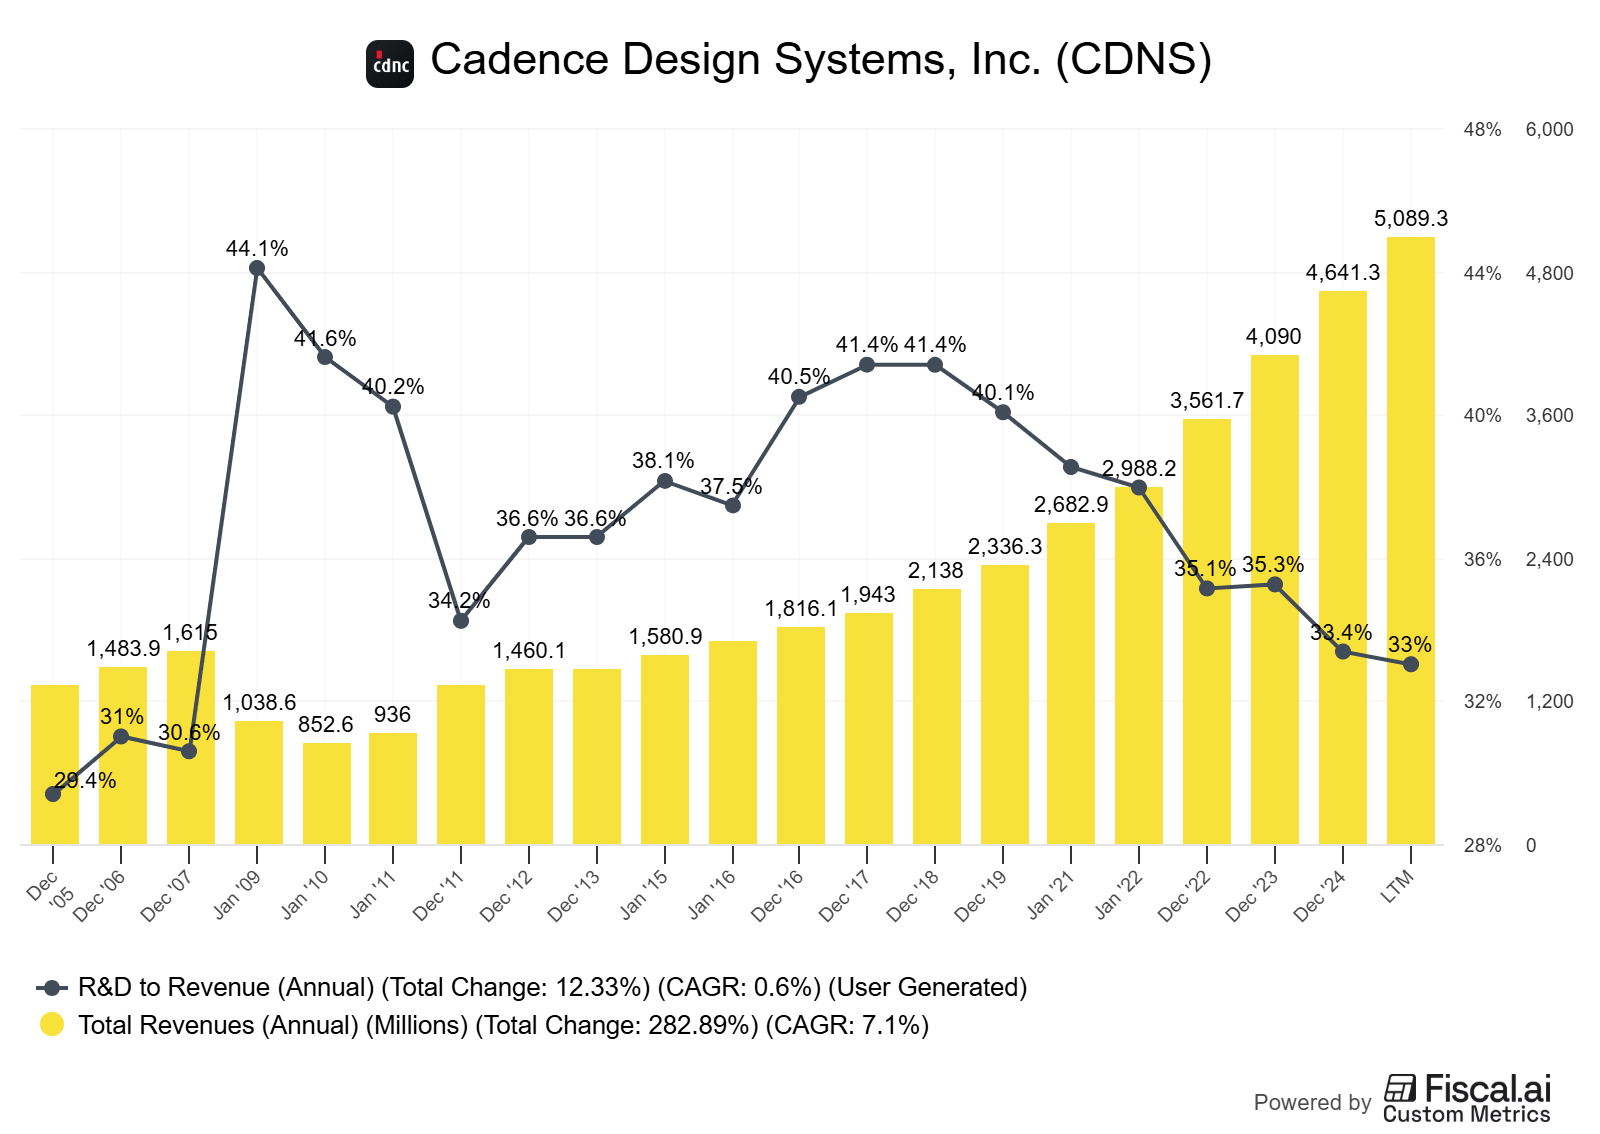
We focus on two US leaders in electronic design automation (EDA): Cadence Design Systems (CDNS) and Synopsys (SNPS). Both report substantial R&D; both combine organic development with acquisitions (creating amortizable intangibles); both have high recurring elements in their models.
GAAP backdrop: Software/EDA companies generally expense R&D as incurred under ASC 730; acquired intangibles are capitalized and amortized; certain internal-use software or development costs may be capitalized under ASC 350-40 and, if applicable, ASC 985-20.
Cadence’s 10-Ks detail R&D expense and amortization of intangibles (e.g., 2018 10‑K, as of 2025-10-15).
Synopsys’ latest 10-K XBRL tags explicitly reference “Capitalized software development costs” among other intangibles, indicating some capitalized development within GAAP categories (Synopsys 2024 10‑K XBRL, as of 2025-10-15).
Important: The analytical R&D capitalization below is for investor normalization; it does not change cash.
Below is an illustrative snapshot (not company guidance; simplified, round numbers for educational purposes to show mechanics).
Table 1: Illustrative R&D capitalization impact (2024 baseline; educational only)
Company GAAP Op Margin R&D as % Sales R&D Amort. Life (yrs) Adjusted Op Margin Adjusted ROIC vs WACC Cadence (CDNS) 29% 20% 4 34–36% ROIC – WACC +600–800 bps Synopsys (SNPS) 27% 19% 4 32–34% ROIC – WACC +500–700 bps
How to read it: We “capitalize” R&D (e.g., 4-year life), subtract current-year amortization (1/4 of the cumulative R&D asset) instead of expensing the full current R&D, and then recompute operating income and invested capital. Margins and ROIC typically rise if the firm is growing R&D consistently.
Caveats and alternative interpretations
Economic life: A 3–5 year amortization window is common in software analyses; for EDA, align with major node/design cycles. Shorter lives reduce uplift; longer lives increase uplift.
Maintenance vs. growth: If a material portion of R&D is “maintenance,” it should be expensed (or amortized on short lives). Overcapitalizing inflates quality signals.
M&A integration: Acquired intangible amortization is a separate non-cash GAAP expense; it still represents an economic cost of buying rather than building. Consider a pre/post M&A ROIC bridge to assess accretion.
[Infographic: GAAP → Owner Earnings Bridge — purpose and 5 elements: (1) GAAP EBIT; (2) +R&D capitalized – amortization; (3) normalize SBC; (4) maintenance vs. growth split; (5) owner earnings/FCF lens]
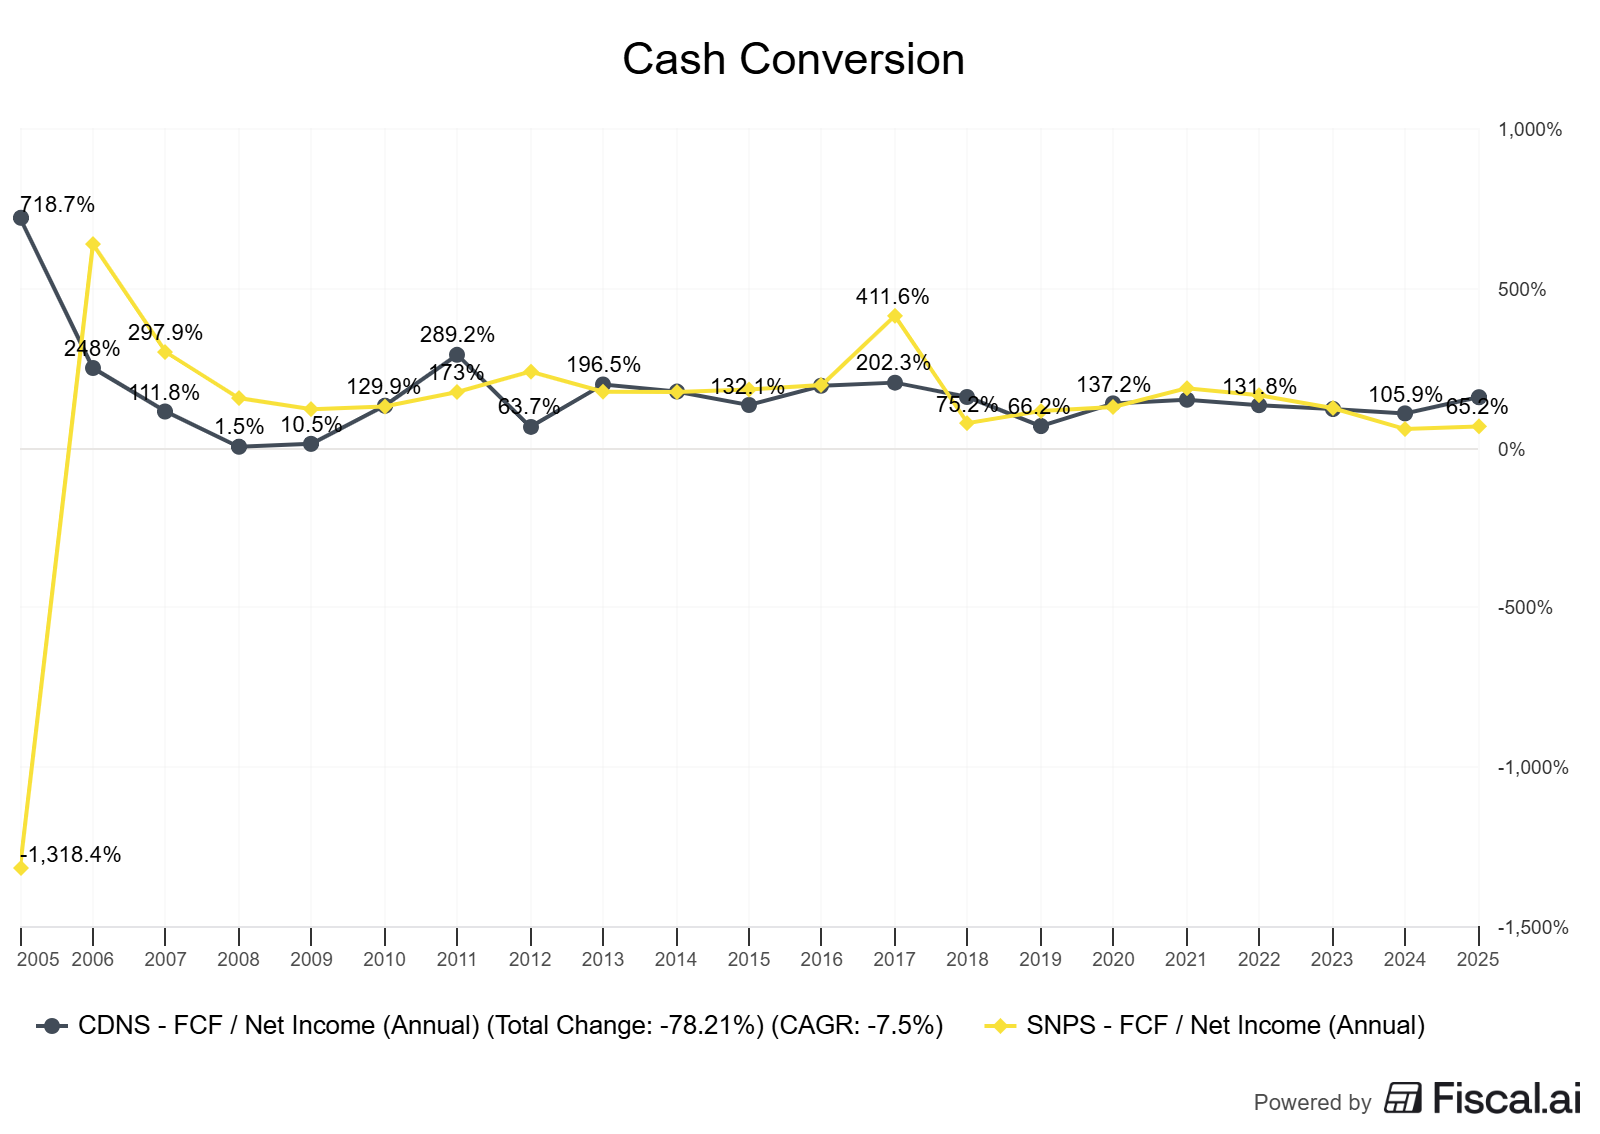
Table 2: Per-share framing snapshot (illustrative; educational only)
Company SBC as % Revenue Dilution/Buyback (5y) FCF Margin Range Share Count CAGR Cadence (CDNS) 4–6% Net buyback 25–30% ~–1% to 0% Synopsys (SNPS) 4–6% Net buyback 24–28% ~–1% to 0%
Interpretation: If per-share FCF grows faster than revenue, and share count is flat/down, capital allocation supports per-share value creation even with meaningful SBC. Always reconcile SBC issuance with repurchases.
How to do this yourself (step-by-step guide)
Step 1: Gather filings. Download the latest 10-K/20-F, investor deck, and segment notes. For CDNS and SNPS, start with SEC EDGAR pages in the references. Note R&D policy, acquired intangibles, any explicit “capitalized software development costs,” and SBC disclosures.
Step 2: Set your R&D policy. Decide whether to capitalize a portion of R&D. Choose an amortization life (3–5 years) based on product cycles (EDA node progression, platform cadence). Document the rationale.
Step 3: Build the R&D asset. For each of the past 5–10 years, add the capitalized portion of R&D to an “R&D asset,” and amortize on a straight-line basis over your chosen life. The current-year P&L gets R&D amortization instead of 100% expense.
Step 4: Recompute adjusted metrics. Recalculate EBIT, NOPAT, invested capital (include the R&D asset net of accumulated amortization), ROIC, and FCF conversion. Keep a parallel GAAP view for transparency.
Step 5: Per-share and SBC sanity checks. Track EPS/share, FCF/share, and share count CAGRs. Tie SBC to talent needs and moat reinforcement; evaluate if buybacks more than offset dilution.
Step 6: Decision rules. Prefer sustained ROIC – WACC > 5% post-adjustment; stable/improving margin bands; FCF conversion steady through cycles; retention and pricing power evidenced by renewals and backlog.
Pitfalls and false positives (what commonly misleads investors)
Overcapitalizing R&D: Treating maintenance or bug-fix cycles like long-lived assets inflates quality optics and ROIC. Anchor to product life and customer upgrade cadence.
Ignoring amortization: Capitalizing is not free; amortization should reflect economic decay. If innovation pace is rapid, shorter lives are more realistic.
SBC myopia: High adjusted profits alongside heavy dilution still destroy per-share value. Always view through a per-share lens.
M&A masking: Acquisitions add amortization and goodwill. Use a pre/post ROIC bridge to separate core quality from acquired optics.
One-period reads: Year-to-year noise (especially around major node transitions or large deals) can distort signals. Use 5–10 year trend views.
Checklist / one-pager (actionable bullets readers can save)
Define a 3–5 year R&D capitalization policy tied to product cycles; document it.
Recompute ROIC with the R&D asset and compare to WACC; target >5% spread sustained.
Track per-share FCF and EPS vs. share count changes; avoid net dilution.
Separate maintenance vs. growth R&D; be conservative on lives and amortization.
Use 10-year charts for ROIC/WACC, FCF conversion, and margin bands for durability.
Mini-FAQ
Q: Does capitalizing R&D change cash flow?
A: No. It’s an analytical reclassification for comparability. Cash flow is unaffected; you’re clarifying earnings power and invested capital.
Q: How do I choose the amortization life?
A: Match the product/technology life. For EDA, 3–5 years is common. If cadence is faster, shorten the life; if platforms endure longer, extend—be consistent.
Q: Should I capitalize all R&D?
A: No. Carve out maintenance or compliance-type spend as expense. Capitalize the parts that clearly create multi-year customer value.
Q: What about acquired intangibles amortization?
A: Keep it as an economic cost of “buy” vs. “build.” Show both: GAAP with amortization and an “owner earnings” view if you prefer, but don’t ignore it.
Q: How does SBC fit in?
A: SBC is compensation. Incorporate it into per-share analysis. If buybacks offset dilution and per-share FCF grows, SBC may be acceptable; if not, it erodes value.
Glossary
ROIC: Return on Invested Capital; NOPAT divided by invested capital, a core quality metric.
WACC: Weighted Average Cost of Capital; the hurdle rate for value creation.
R&D Capitalization: Analytical treatment of R&D as an intangible asset amortized over economic life.
Owner Earnings: Cash earnings available to owners after maintenance reinvestment needs.
SBC: Stock-Based Compensation; non-cash expense with real dilution implications.
Intangible Asset Amortization: Non-cash expense reflecting the economic consumption of acquired or capitalized intangibles.
Further reading
Cadence Design Systems — SEC Filings Landing Page (as of 2025-10-15): SEC EDGAR: Cadence (CDNS) Entity Page
Synopsys — 2024 10-K XBRL (as of 2025-10-15): SEC: snps-20241031
Cadence Design Systems — 2018 10-K (as of 2025-10-15): SEC: cdns-2018 10‑K
Synopsys — 2015 10-K (as of 2025-10-15): SEC: snps-2015 10‑K
References (linked source list with “as of” dates)
Cadence Design Systems — SEC EDGAR Company Page. As of 2025-10-15. SEC EDGAR: Cadence (CDNS)
Cadence Design Systems — Annual Report on Form 10-K for year ended Dec 29, 2018. As of 2025-10-15. SEC: cdns-2018 10‑K
Synopsys — Annual Report on Form 10-K (XBRL) for year ended Oct 31, 2024. As of 2025-10-15. SEC: snps-20241031
Synopsys — Annual Report on Form 10-K for year ended Oct 31, 2015. As of 2025-10-15. SEC: snps-2015 10‑K
Disclaimer
Educational content, not investment advice.
The point about GAAP penalizing R&D intensive companies really hits home when you look at software firms. Treating R&D as a period expense makes it impossible to compare apples to apples across diferent industries. The 3-5 year amortization schedule you suggest seems reasonable for most tech companies given typical product lifecycles.