
SAP’s Cloud Transition, Decoded: Revenue Recognition, RPO, and Quality Through the Cycle

Cloud transitions can look great on headlines, but can be fuzzy in the cash flow. For quality-focused investors, the key is distinguishing between revenue optics and economic substance.
Today’s article walks through SAP’s cloud shift using revenue recognition, remaining performance obligations (RPO), and free cash flow conversion to assess what’s real and durable.
TL;DR
Cloud revenue recognized over time is “smoother,” but cash flow depends on billing and contract structure; follow deferred revenue and unbilled receivables.
SAP discloses the “current cloud backlog” (CCB) and the total cloud backlog; the CCB represents a 12-month view. Growth changes reflect FX, mix, billing, and macro, not just demand.
For a quality lens: emphasize ROIC versus WACC, per-share value creation, FCF conversion, and evidence of pricing power and retention (not claims).
Build an IFRS-to-owner-earnings bridge: adjust for restructuring, SBC, and capitalized development while normalizing working capital.
Decision rules: prefer sustained ROIC – WACC > 5%, FCF/NI > 90% over a cycle, and backlog growth that translates into expanding FCF per share.
SAP’s Q2 FY25 disclosures show strong cloud trends and improving margins; judge sustainability through backlog-to-revenue translation, retention, and disciplined capital allocation as of Jul 22, 2025, SAP Investor Relations.
Why it matters
Revenue recognition in software is deceptively simple: subscriptions are recognized over time, while licenses are recognized at a point in time. But the economics can diverge from reported revenue because cash inflows depend on billing terms (annual upfront vs. quarterly), the contract mix (SaaS vs. software license + maintenance), and the balance sheet (deferred revenue and unbilled receivables). During a cloud transition, all three move.
Investors often misread cloud backlog signals. A deceleration in the “current cloud backlog” (the next 12 months' slice of contracted cloud revenue) can reflect foreign exchange, regional mix, or billing cadence. Conversely, rapid backlog growth may not translate into owner earnings if churn is high or contracts are low margin. The base rate lesson: prioritize cash conversion and unit economics over top-line growth.
For quality investors, the core test is durability: does the company consistently earn returns on incremental capital above its cost of capital, with a long runway? In cloud ERP, evidence is found in renewal rates, pricing power, switching costs, and per-share value creation backed by FCF.
Core concepts (quality-investing angle)
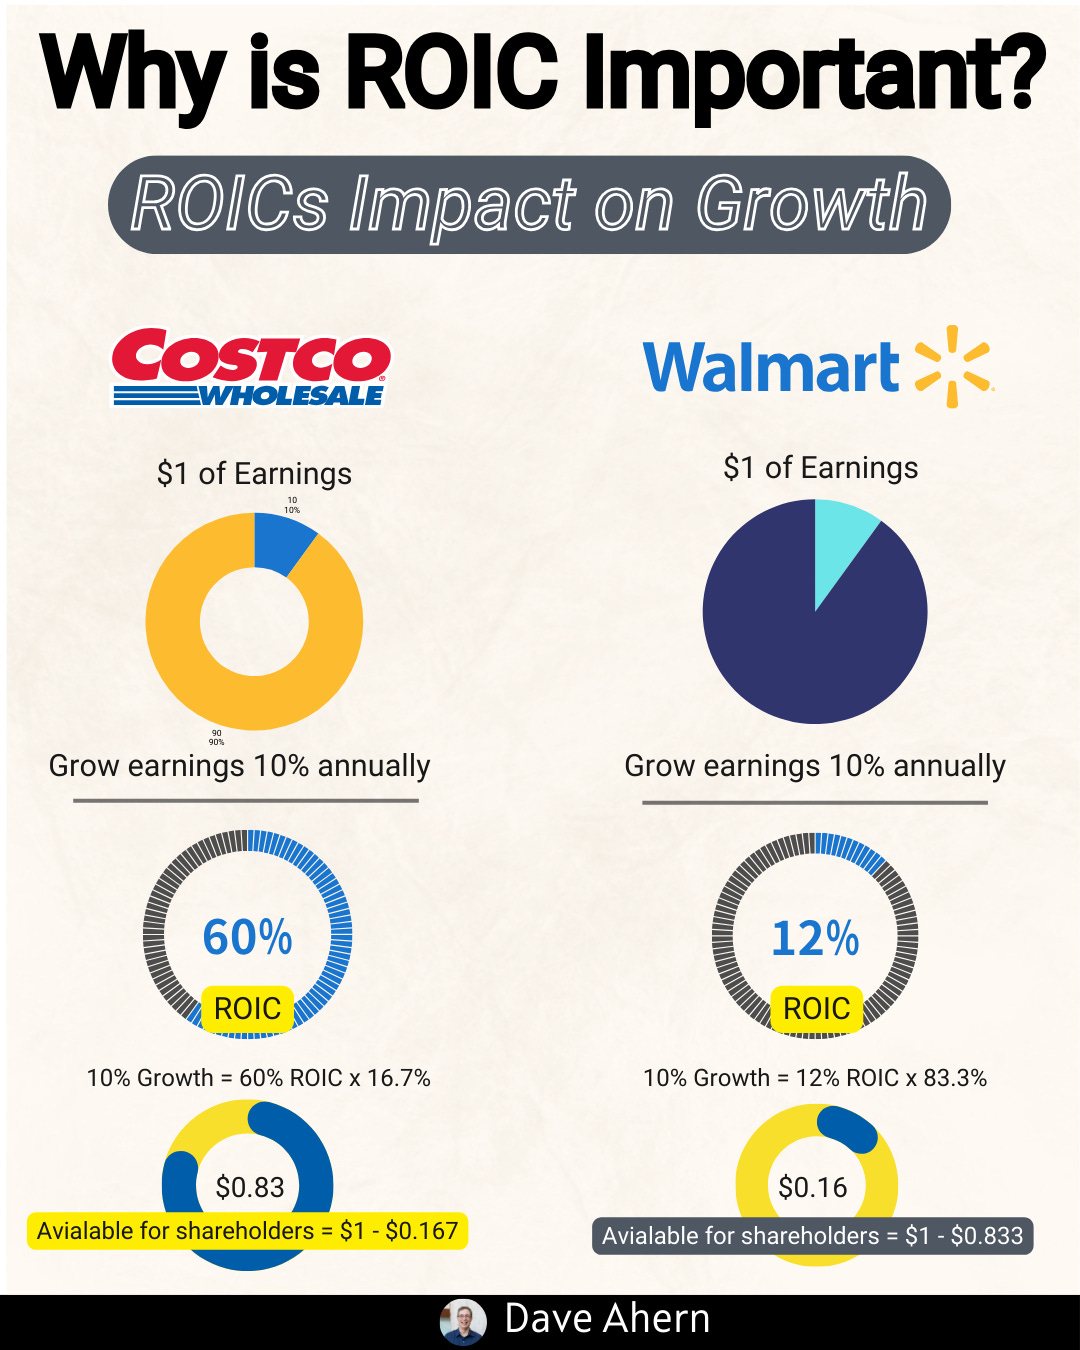
ROIC vs WACC and value creation
ROIC (return on invested capital) measures how effectively a company turns invested capital into after-tax operating profit (NOPAT).
WACC (weighted average cost of capital) reflects the blended cost of equity and debt.
A sustained ROIC > WACC indicates economic value creation. For software platforms with high switching costs, we seek sustained spreads.
Decision rule: Prefer businesses with an ROIC–WACC ratio greater than 5% across cycles and stable margins. Use mid-cycle assumptions to avoid peak bias.
Reinvestment runway and capital intensity
Quality plus growth requires places to deploy capital at high returns.
Cloud ERP adds modules and adjacent workflows; think RISE with SAP and extension suites as vehicles for reinvestment with low incremental capital intensity.
Watch organic vs. inorganic growth. Acquisitions can mask organic unit economics.
Unit economics and per-share metrics
Unit economics: LTV/CAC, net retention (NRR), module expansion, and support attach.
Per-share framing: FCF per share, EPS per share, and share count trends. Buybacks matter when done below intrinsic value; SBC (stock-based compensation) can dilute.
Moat durability and evidence (not claims)
Evidence: multi-year renewal rates, switching costs (ERP is mission-critical), price uplifts on renewals, and module attach rates.
ERP migrations are costly and disruptive, reinforcing switching costs and pricing power—if product value keeps up with inflation and innovation.
Case/Accounting Saturday: accounting nuances and economic reality
IFRS 15 revenue recognition:
Cloud subscriptions (SaaS/PaaS): recognized ratably over the service period.
Software licenses (on-prem): typically recognized at a point in time when control transfers.
Maintenance/support: over time.
Multi-element deals: allocate consideration based on standalone selling prices.
RPO vs SAP’s definitions:
Remaining Performance Obligations (RPO) is the IFRS umbrella for contracted revenue not yet recognized.
SAP discloses “current cloud backlog” (CCB), a 12-month contracted cloud revenue view, and “total cloud backlog.” CCB is not identical to total RPO; it focuses on the near-term cloud slice and excludes non-cloud elements (per SAP disclosures in the 20-F and investor materials). See SAP’s 20-F for definitions and reporting framework notes as of Mar 2024, SEC 20-F and as of 2025, SEC 20-F.
Worked example or mini case (mid-cap+; US or international)
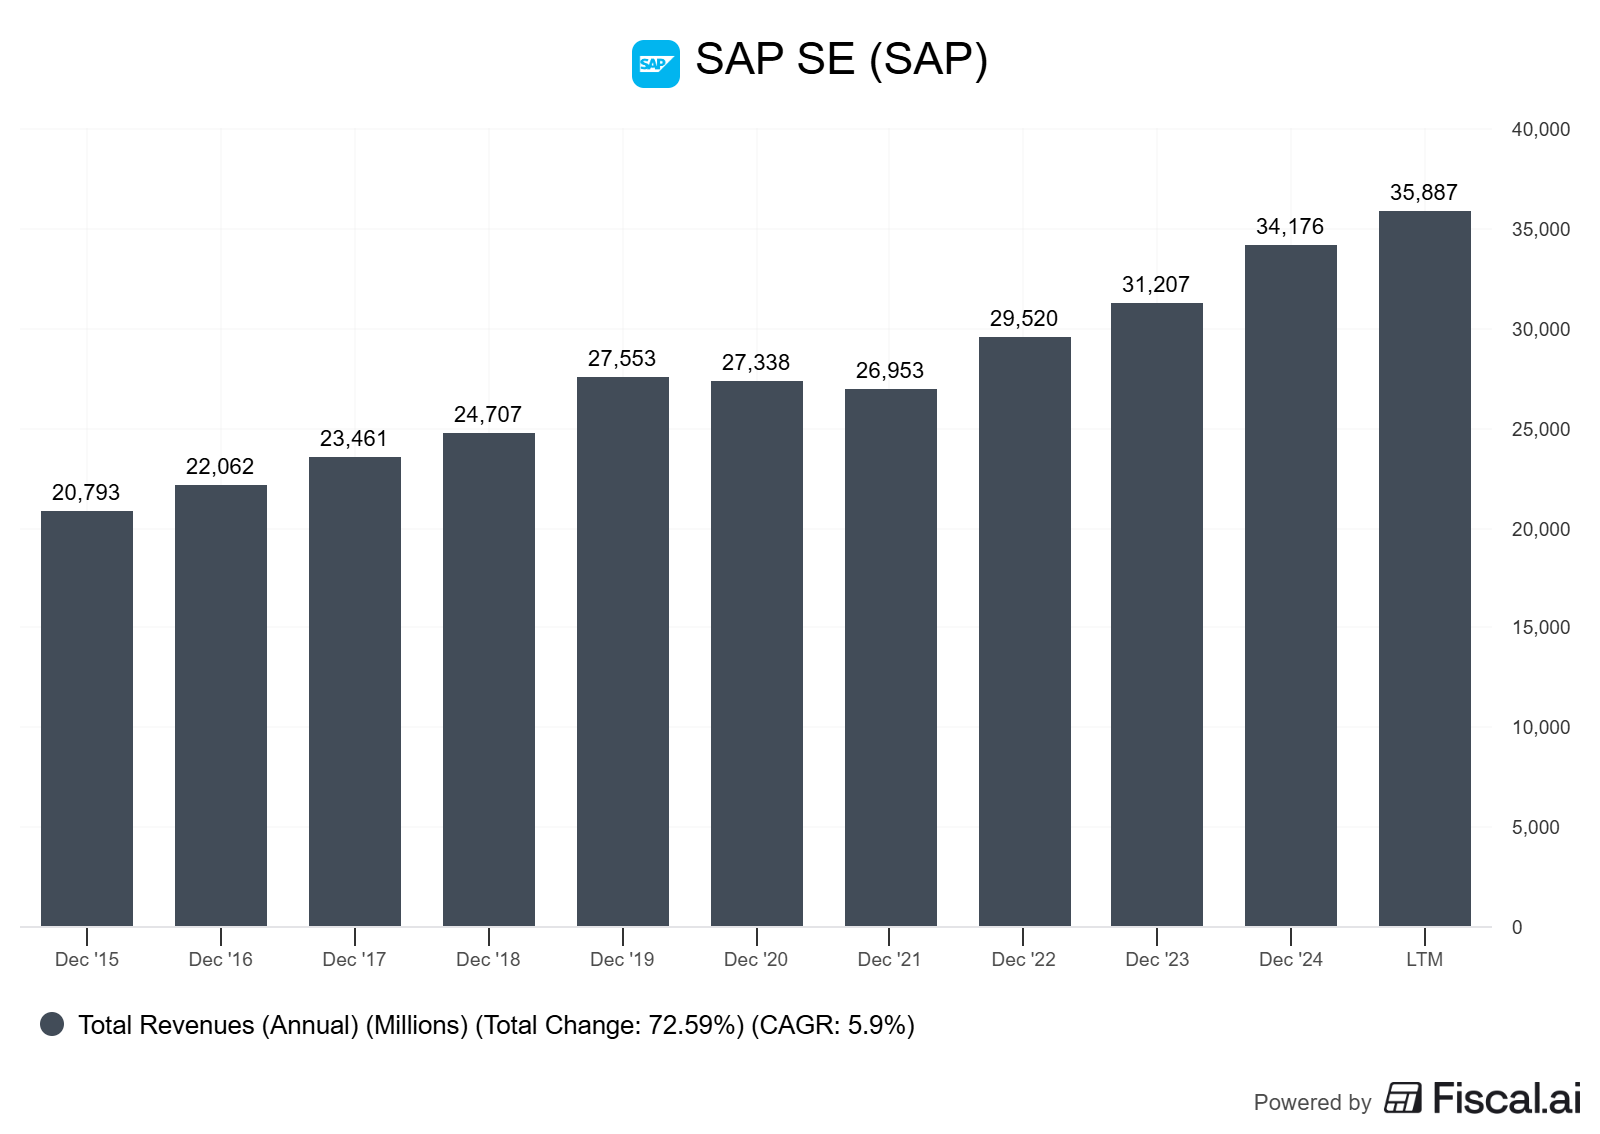
We’ll use SAP (International) as the case. SAP is a large-cap ERP platform with a multi-year transition to cloud, anchored by RISE with SAP and GROW with SAP. The company reports under IFRS and discloses both “current cloud backlog” and total backlog.
Selected recent datapoints (all as of Jul 22, 2025, unless noted):
Current cloud backlog (CCB) €18.1B, up 22% YoY; up 28% at constant currency SAP Investor Relations.
Cloud revenue €5.13B, up 24% YoY; Cloud ERP Suite revenue €4.42B, up 30% YoY SAP Investor Relations.
Share of more predictable revenue 86% (+2pp YoY) SAP Investor Relations.
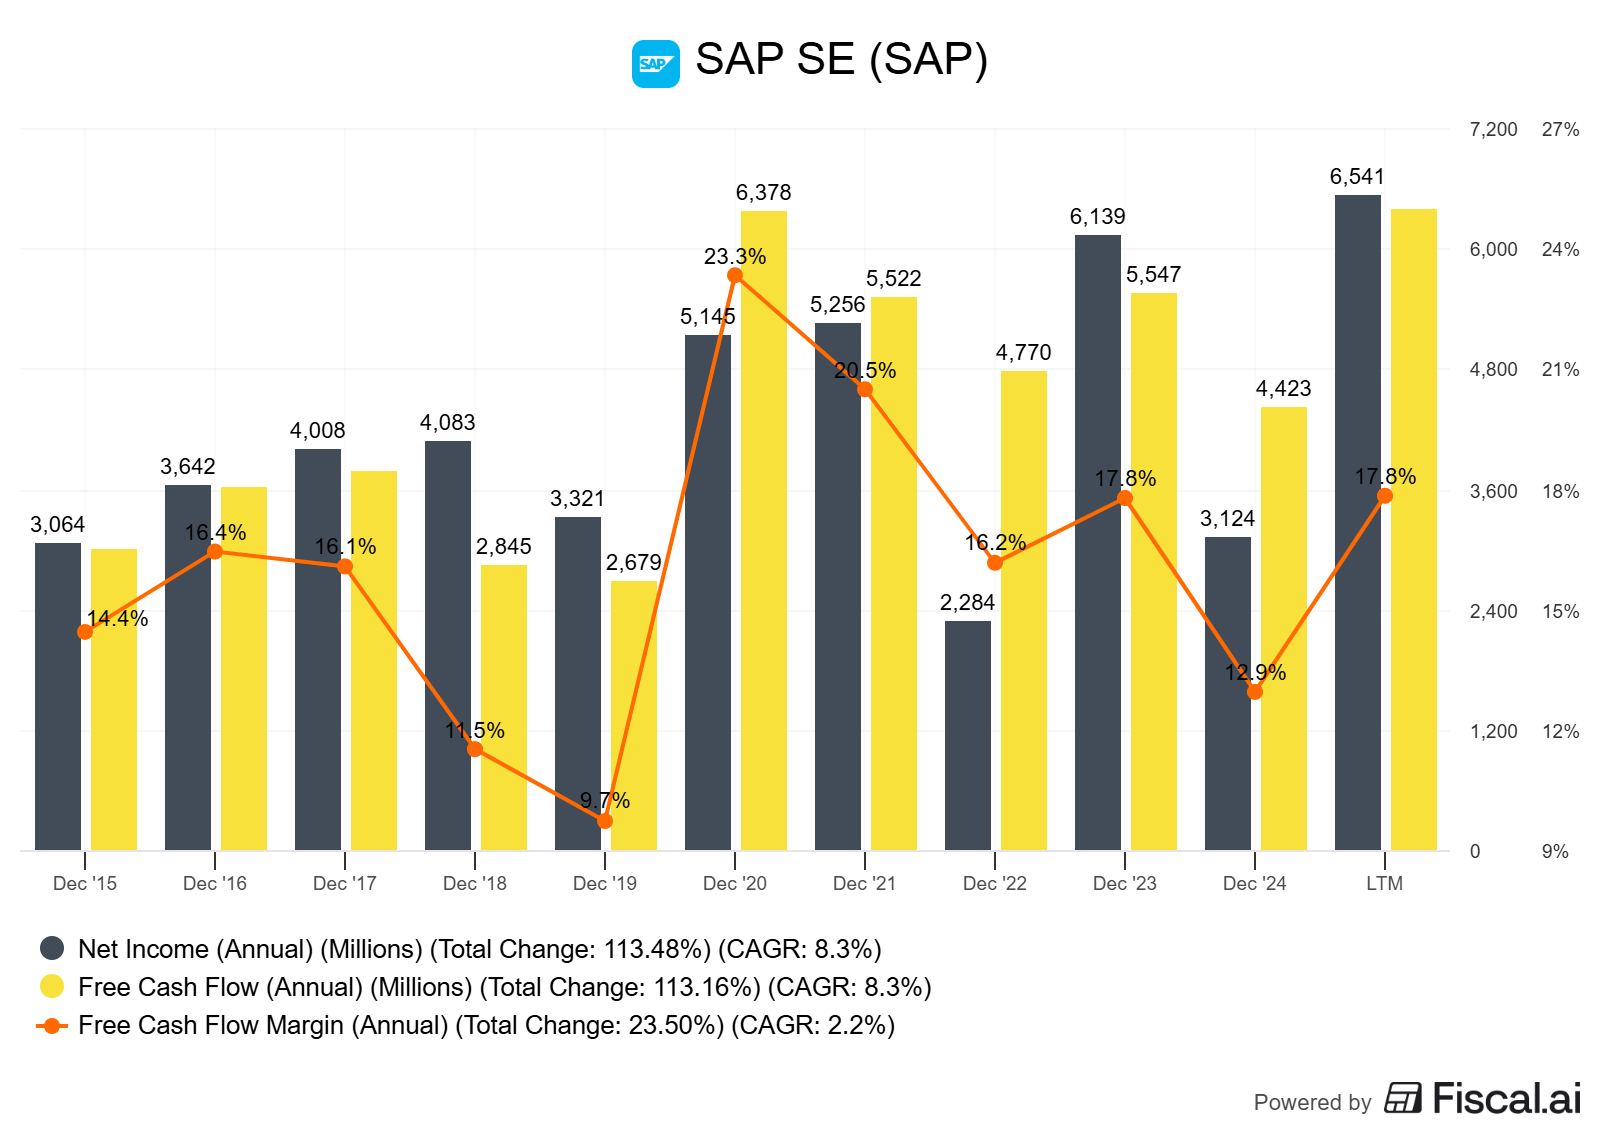
H1 FY25 free cash flow €5.94B (+51% YoY) SAP Investor Relations.
SAP repurchased ~24.7M shares for ~€4.6B under a €5B program through June 30, 2025 SAP Investor Relations.
Total cloud backlog was disclosed at ~€63B at end of 2024 (record high) SEC filing, Integrated Report excerpt, as of 2024 year-end.
Q2 FY25 press materials confirm CCB growth and cloud margin expansion (cloud gross margin ~75%) SAP Newsroom Press Release, Jul 22, 2025.
Accounting lens: revenue vs. cash
Cloud revenue trends are strong, but the quality test is conversion into free cash flow and owner earnings. SAP’s H1 FCF increase was driven by higher profitability and working capital tailwinds, including lower restructuring and SBC payouts SAP IR, Jul 22, 2025.
As subscription mix rises, deferred revenue becomes more meaningful. Review growth in contract liabilities and unbilled receivables for timing effects.
Quality lens: moat signals and reinvestment
ERP switching costs are high, providing pricing power if value keeps up.
The cloud ERP suite and Business Technology Platform (BTP) support module attach and expansion.
The backlog footprint and “share of more predictable revenue” suggest durability. The investor job is to test how much of CCB converts into cloud revenue, gross margin, and ultimately FCF per share.
Caveats and alternative interpretations
CCB growth deceleration versus prior quarters can reflect FX, public-sector timing, and tariff-related approval delays (management cited these factors) rather than primary-demand weakness SAP IR; SAP news, Jul 2025.
Non-IFRS margins benefit from lower SBC and restructuring normalization; ensure your “owner earnings” add back only what is truly non-recurring.
AI product attach contributes to deal size; separate durable subscription uplift from one-off deal composition.
How to do this yourself (step-by-step guide)
Gather the right sources
Annual filings and 20-F (IFRS policies; segments; SBC; restructuring): SAP 20-F 2023/2024, 2024/2025.
Quarterly statements and presentations for backlog, cloud mix, margin, FCF: SAP Investor Relations, Recent Results.
Reporting Framework and definitions (CCB, Cloud ERP Suite): SAP Reporting Framework.
Press releases for timely CCB and cloud growth: SAP Newsroom Q2 2025.
Build a revenue recognition map
Read IFRS 15 note: separate over-time elements (cloud, support) and point-in-time (licenses).
For multi-element deals, note the allocation basis and any variable consideration.
Flag any usage-based elements (e.g., platform consumption) that create variability.
Reconcile backlog to revenue
Track current cloud backlog (12-month window) and total backlog.
Compare CCB growth to cloud revenue growth; chart the ratio over time.
Adjust for FX (SAP publishes constant currency growth).
Owner earnings bridge (IFRS → OE)
Start with operating cash flow, then:
Remove one-offs: Restructure payouts and atypical legal items.
Add back SBC as a real expense proxy? Two schools:
Conservative: treat SBC as an expense and account for dilution in per-share metrics.
Alternative: add back SBC in cash, but reduce for buyback cash outlay or dilution.
Adjust for capitalized development costs (if material) to reflect true maintenance R&D.
Normalize working capital (e.g., large deal billing).
Result: recurring owner earnings.
Capital allocation scorecard
Dividends, buybacks (timing vs. valuation), M&A discipline, internal R&D.
Per-share outputs: FCF/share trend; share count trend.
Thresholds: prefer FCF/NI > 90% over a cycle; steady or declining share count on a rising FCF/share path.
Quality decision rules
Sustained ROIC – WACC > 5% (mid-cycle).
Gross margin and operating margin stability with rising cloud mix.
Measurable pricing power (renewal uplifts) and high net retention.
Backlog translation into revenue and FCF without ballooning unbilled receivables.
No chronic reliance on one-offs to hit profit and FCF.
Pitfalls and false positives
Backlog ≠ cash: CCB growth without FCF growth can signal weak unit economics or billing mix.
Over-reliance on adjusted metrics: Non-IFRS is useful, but it normalizes SBC and restructuring.
License “optical” growth: point-in-time license spikes can flatter revenue without stickier economics.
Ignoring FX: Constant-currency growth matters for global software; headline growth can be misleading.
Treating AI mentions as economics: look for monetization (attach rates, ARPU uplift), not press-release density.
Checklist / one-pager
Revenue recognition map built? Over time vs point-in-time identified.
CCB and total backlog charted, with FX and seasonality noted.
Cloud gross margin and operating margin trend assessed.
FCF conversion tracked (FCF/NI; FCF margin).
IFRS → Owner earnings bridge complete, with SBC and restructuring normalized.
Per-share lens: FCF/share up and share count stable/down?
ROIC vs WACC estimated on a mid-cycle basis; spread > 5%?
Capital allocation: buybacks vs dilution, dividends, M&A discipline.
Glossary
IFRS 15: Accounting standard for revenue recognition; governs over-time vs point-in-time revenue.
RPO: Remaining performance obligations—contracted revenue not yet recognized.
CCB: Current cloud backlog—SAP’s contracted cloud revenue expected over the next 12 months.
NOPAT: Net operating profit after tax; used in ROIC.
ROIC: Return on invested capital; NOPAT divided by invested capital.
WACC: Weighted average cost of capital; required return for creditors and shareholders.
SBC: Stock-based compensation; non-cash expense that dilutes equity holders.
Owner earnings: Normalized recurring cash flows available to owners, adjusted for one-offs and maintenance needs.
Further reading
SAP Q2 FY25 Results, statements and presentation (Jul 22, 2025): SAP Investor Relations
SAP Q2 FY25 press release (Jul 22, 2025): SAP Newsroom
SAP 20-F (Dec 31, 2023) — definitions and revenue policies: SEC 20-F link
SAP 20-F (Dec 24/31, 2024) — reporting metrics: SEC 20-F link
References (linked source list with “as of” dates)
SAP Investor Relations — Q2 FY25 results page, statement, H1 report; as of Jul 22, 2025: SAP IR — Recent Results
SAP Newsroom — Q2 and HY 2025 Press Release; as of Jul 22, 2025: SAP News
SEC — SAP SE 20-F (Dec 31, 2023) — revenue recognition and KPIs; as of Mar 2024: SEC 20-F 2023
SEC — SAP SE 20-F (Dec 24/31, 2024) — cloud backlog definitions; as of Mar 2025: SEC 20-F 2024
SEC — Integrated report excerpt on total cloud backlog (€63B at YE 2024); as of 2024 year-end: SEC Exhibit
Accounting bridge: sketching IFRS → owner earnings (SAP)
Start: Net income (IFRS).
Add back non-cash D&A.
Adjust:
Subtract SBC as an economic cost (or neutralize via buyback cash and dilution).
Remove restructuring charges and related cash payouts (non-recurring), but keep “maintenance-level” transformation if ongoing.
Consider capitalization of development costs: add back capitalized amounts and subtract maintenance R&D to reflect steady-state.
Normalize working capital: adjust for outsize deferred revenue inflows or collections that are timing-related.
Result: Owner earnings.
Validate: Compare to multi-year FCF and FCF/share; cross-check against backlog translation.
How to think like a quality investor here
Separate “subscription optics” from “economics”: does more predictable revenue translate into more persistent FCF?
Focus on evidence of pricing power: renewal uplift, module attach, and retention > 110% NRR (if disclosed).
Test capital allocation: is the buyback offsetting SBC dilution and raising FCF/share, or simply cosmetic?
Favor businesses where backlog growth turns into cash without ballooning unbilled receivables.
Use mid-cycle ROIC and margins; don’t extrapolate peak quarters.
Keep a per-share mindset: total FCF matters less than FCF per share five years from now.
One of the BEST substack accounts! It would be nice a post about how to analyze cyclical companies like energy production, automovile and steel production companies.Thanks for your great job.