
S&P Global: a full analysis starting with Stock Simplifier
The dividend is only half the analysis. Here is how to do the rest.

There are two parts to a complete stock analysis. The first is understanding the business, its quality, competitive position, growth outlook, and whether the price makes sense. The second is understanding whether the dividend is safe and how the company deploys its cash. Strong businesses fail the second test all the time by paying out more than they earn or buying back stock at terrible prices.
Most dividend investors focus on the dividend part, the yield, payout, dividend growth, etc.
But the first part is as important, if not more so, because without the quality, moat, growth, and good price, the dividend gets lost in the investment. For example, if you buy a company paying a high yield, and that yield is unsustainable, then guess what? You have a failed investment, and possibly years of compounding wasted.
This is why focusing on the company's fundamental analysis is so important.
Today’s analysis will show how to do both parts.
For this analysis of S&P Global (SPGI), I used two layers. Stock Simplifier, Brian Feroldi’s new interactive analysis tool, handled the first layer by walking through all nine sections of the business framework with live data from Fiscal.ai. Stock Simplifier is still in beta, and I was given early access, which I am sharing with you.
My own dividend safety tools handled the second. The combination gives you a complete picture.
One of the many cool parts of this tool is the ability to dive deeper with each layer of analysis. Stock Simplifier uses the power of Fiscal data and AI tools to uncover each layer of the business. At each layer, you can see a brief overview, but in the PRO version, you can click a tab (which I will show you in a minute) that gives you much more information.
And the best part is, it saves you time. As a stock analyst without the luxury of spending hours reading and studying, Stock Simplifier lets you work through a company quickly. If you know the company, Visa, for example, I can update myself in less than 15 minutes. And if you are new to the business, you can determine quickly whether you want to dig deeper or not, thus saving you hours on a company you might not want to own.
For example, I read through all the information on Merck (a company I knew nothing about) in about 30-40 minutes.
Bottom line, this tool gives you the info you need quickly.
Here’s the full analysis.
Layer one: the Stock Simplifier framework
The business
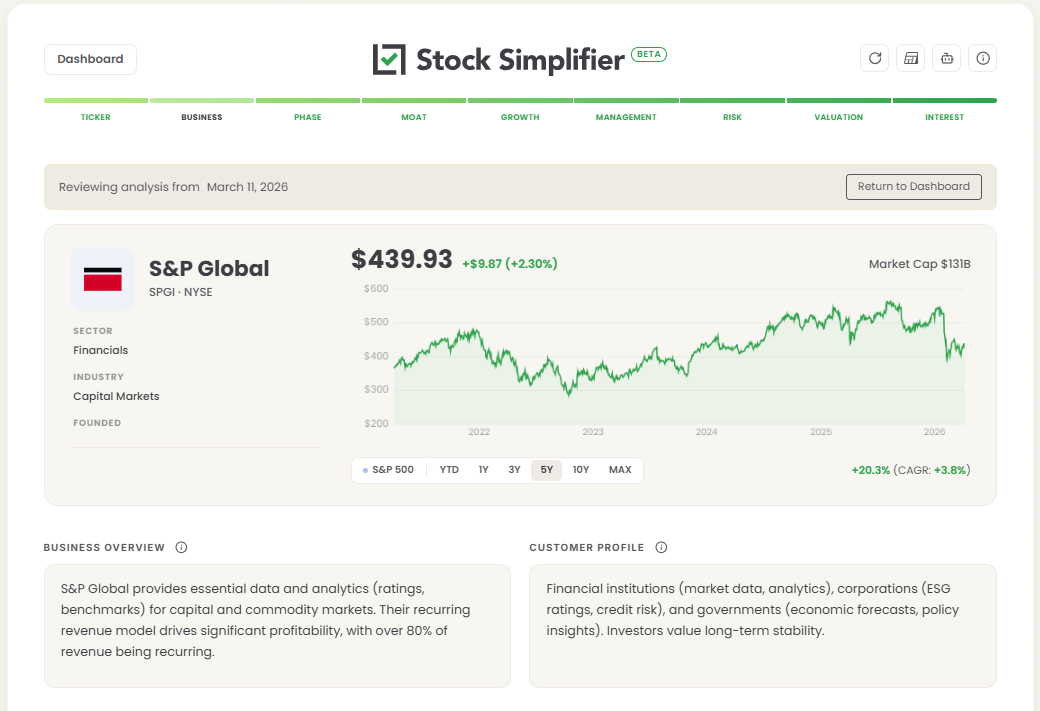
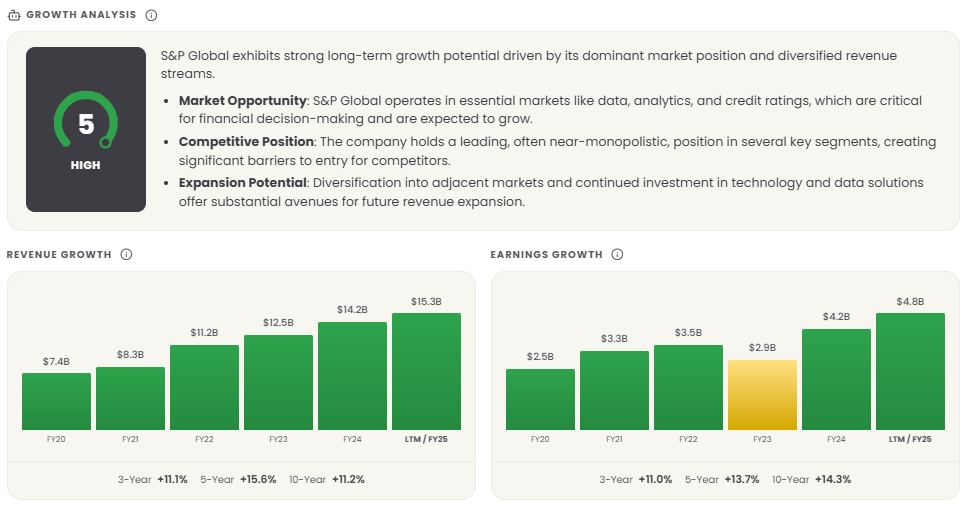
S&P Global generated $15.3 billion in revenue in fiscal year 2025 (FY25), up 8% year over year. Roughly 70% of that revenue comes from subscriptions and long-term contracts, which means most of what SPGI earns in a given year is locked in before January 1.
The company runs five segments. Ratings handles credit assessments for bond issuers and holds roughly 40% of the global market alongside Moody’s (MCO); together, the two firms are effectively unavoidable infrastructure for anyone raising debt. Market Intelligence provides financial data and analytics to investment professionals, with over 80% of revenue recurring. S&P Dow Jones Indices earns asset-linked fees on exchange-traded funds (ETFs) and mutual funds benchmarked to S&P indices, with roughly $5 to $6 trillion in assets tracking the S&P 500 alone. Commodity Insights provides benchmark pricing for energy and metals markets. Mobility covers automotive data and analytics.
Stock Simplifier asked me to rate the business, which I gave it a “Excited”, a 5 out of 5. Two of its supporting assessments are the ones worth noting: revenue is Predictable, and the company can raise prices easily. Annual price increases of 3 to 5% on existing contracts are standard across the subscription segments, and Market Intelligence renewal rates have held above 90%.
Business phase
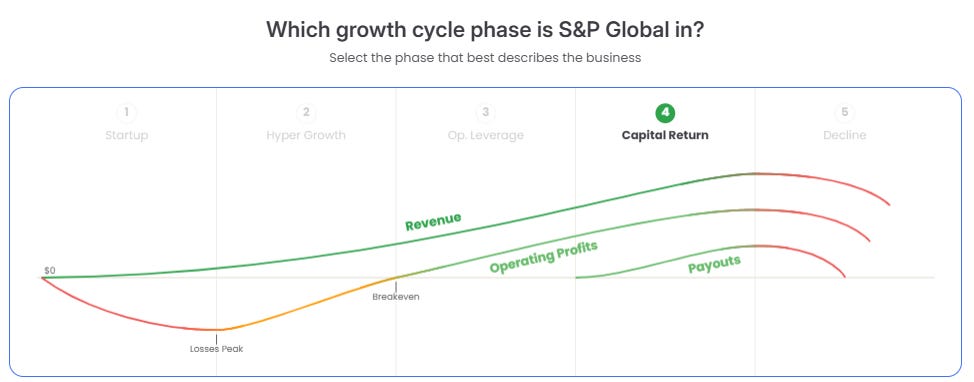
Stock Simplifier places SPGI in Phase 4: Capital Return. This is the phase where a business has moved past hyper-growth, established its dominant position, and generates more cash than it can reinvest at high rates of return. The excess flows back to shareholders.
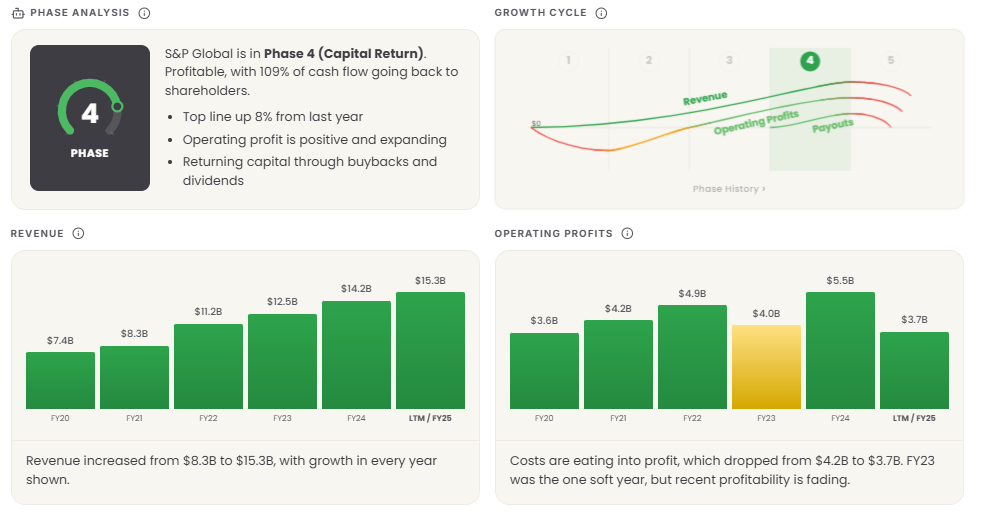
For SPGI, this is accurate. The company completed its major acquisition cycle with IHS Markit in 2022, spent two years integrating and capturing synergies, and now runs a capital return program targeting 85% of adjusted free cash flow (FCF) for return to shareholders each year. Operating margins sit above 50% across the combined business.
Each section of the analysis asks you to examine each part and assign it a rating. The tool will display its rating at the top, and at the bottom, you will have the chance to give your own rating.
Moat
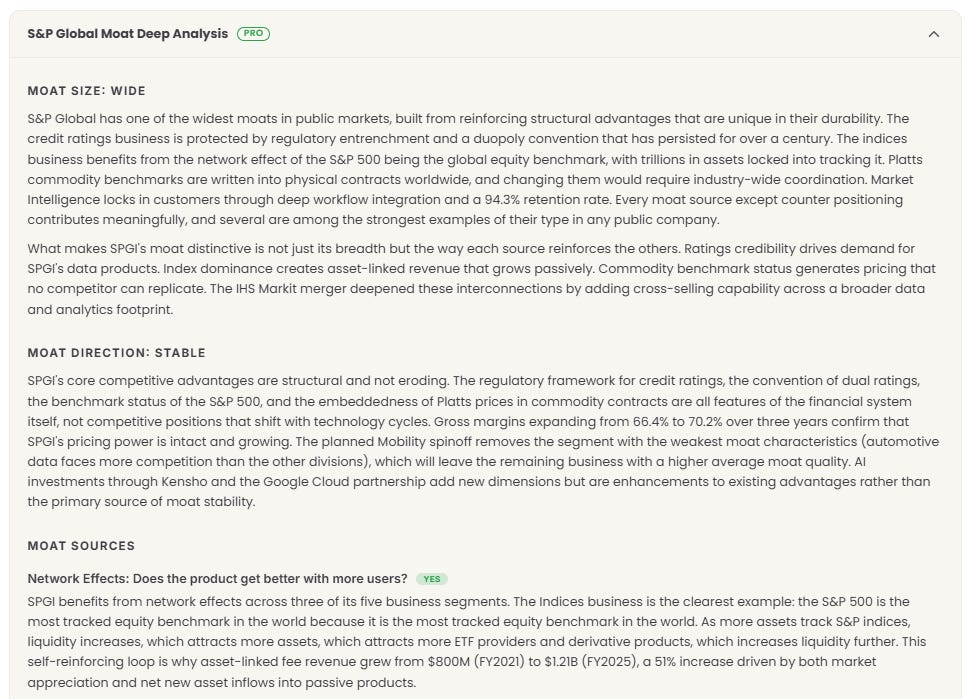
Stock Simplifier scored SPGI’s moat as Wide (5) with a direction of Growing (4). The three sources it identified are correct. And I concurred with this scoring.
Switching costs: Market Intelligence customers build internal workflows that rely on Capital IQ data. Replacing a data provider means rebuilding those workflows, retraining staff, and accepting months of productivity loss. The switching cost is not just the subscription — it’s the disruption to everything built on top of it.
Licensing: The S&P 500 index is among the most widely licensed financial products. Any ETF or structured product tracking it pays SPGI a fee. That arrangement is protected by trademark and contract. No competitor can build a meaningful alternative because the brand recognition and the existing assets under management (AUM) tied to the index are the product itself.
Network effects: Credit ratings improve in value as more issuers get rated. The more debt is rated, the more investors rely on ratings to make decisions. The more investors rely on ratings, the more issuers need them to access those investors. Each additional participant strengthens the system for everyone already inside it.
The tool also flags SPGI as a disruptor, not a target of disruption, in its core markets. Kensho, which SPGI acquired in 2018, is now integrated across products and enables artificial intelligence (AI) driven analytics that smaller competitors cannot replicate.
Example below of the PRO level analysis, amazing stuff.
Growth
Stock Simplifier scored growth High (5), and I disagreed with it’s assesment. I ended up giving it an Average (3).
Mid-to-high single-digit revenue growth is a realistic expectation through the cycle, with the Ratings segment providing meaningful upside when bond issuance volumes pick up in a lower-rate environment. The Indices segment carries cyclical exposure — if the S&P 500 falls 20%, asset-linked fee revenue falls proportionally.
The longer-term growth question is private credit. That market has grown past $1.5 trillion globally, and most of it goes unrated. SPGI is investing to capture ratings and benchmarking fees there. Early fee rates are below public market equivalents, but the addressable opportunity is significant.
AI monetization also has room to run. Management cited value-based pricing conversations enabled by AI product launches on their Q4 FY25 call. Premium tiers of Capital IQ Pro with AI features command roughly 20-30% higher per-seat pricing than standard subscriptions. Penetration is still low.
We are running this initial analysis for S&P Global (SPGI) with Stock Simplifier, which covers 1,000-plus companies and uses live Fiscal.ai data. If you want to run your own structured analysis on stocks you own or are watching, the link below is where to start. Join the waitlist for when the must-have tool is released.
Management
Stock Simplifier rated management Good (4). Martina Cheung became chief executive officer (CEO) in November 2024, succeeding Douglas Peterson, whose 11-year tenure saw revenue grow from roughly $4.5 billion to over $12 billion. Cheung came up through the Ratings side of the business, which is directly relevant given that the issuer-pay ratings model remains the most-cited structural risk to the company.
Capital allocation history under Peterson was disciplined. Buybacks were consistent. Return on invested capital (ROIC) has held above 20% for most of the past decade. The IHS Markit integration delivered on the synergy targets outlined by management at the time of the acquisition.
Risk
Stock Simplifier’s risk breakdown for SPGI reads: Diversified concentration, is a Disruptor, mostly Independent from outside forces, and has Healthy financial health.
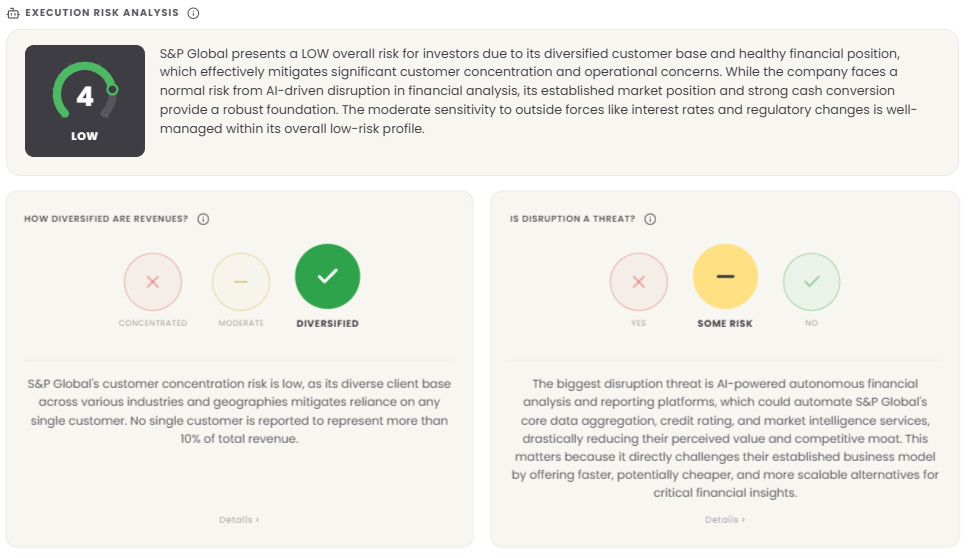
The main risk worth watching is regulation. The Ratings segment is overseen by the Securities and Exchange Commission (SEC) and international equivalents. A rule change forcing structural separation between ratings and data businesses, or mandating a subscriber-pay model, would materially alter Ratings ec’ economics. The probability is low, but the impact would be high.
Competitive risk in Market Intelligence is real but slow-moving. Bloomberg, London Stock Exchange Group (LSEG), and FactSet compete for the same enterprise clients. The balance sheet carries meaningful debt from the IHS Markit acquisition, but FCF generation comfortably services it.
Valuation
Stock Simplifier rated valuation Attractive (4). The supporting data explains why.
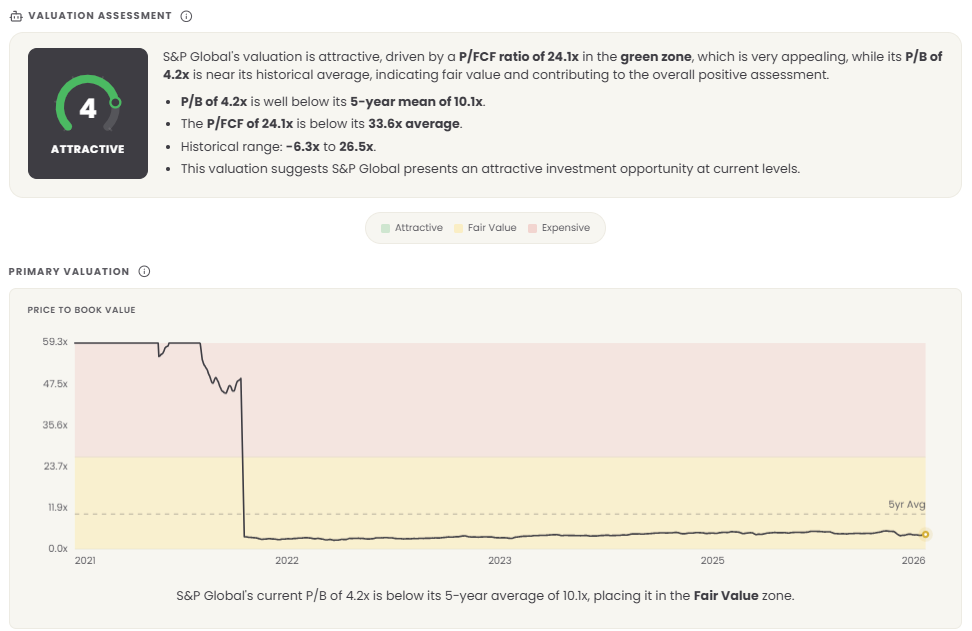
The price-to-free-cash-flow (P/FCF) ratio is 23.5x, compared with a historical average of 33.6x. The price-to-book (P/B) ratio is 4.1x against a five-year mean of 10.3x. The P/FCF historical range has run from negative territory to a high of 26.9x, the current reading sits at the lower end of that range.
You are being asked to pay about 23 times free cash flow for a business that grows at mid-to-high single digits, earns 50%-plus operating margins, and holds a reinforced wide moat. The comparison that matters is what you’re paying versus the business’s own history. A P/FCF of 23.5x against a historical average of 33.6x means either the business has deteriorated structurally (there is little evidence of that) or the market repriced it broadly alongside other richly valued businesses during 2022 through 2024.
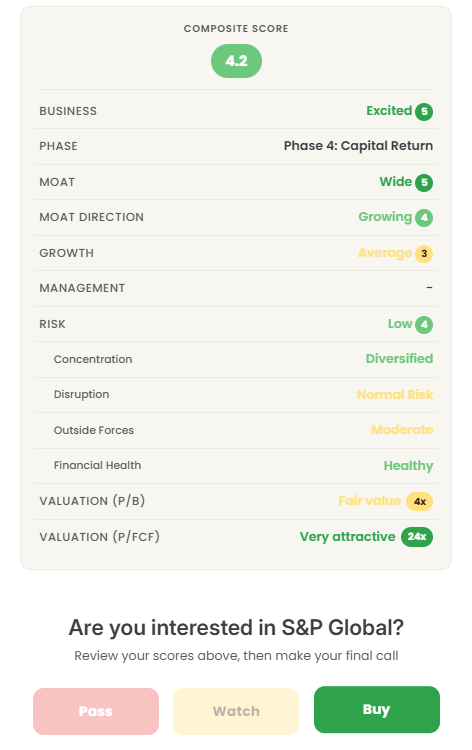
Stock Simplifier composite score: 4.2 out of 5. Verdict: Buy.
Layer two: capital allocation and dividend safety
Stock Simplifier gives you the analytical framework. The next step is understanding what the company does with its cash, and whether the dividend is built to last.
Where the free cash flow goes
SPGI guided adjusted FCF of $5.6 to $5.8 billion for FY25. That’s the pool the company works from.
The stated capital return target is approximately 85% of adjusted FCF returned to shareholders through dividends and share repurchases combined. On a $5.7 billion midpoint, that’s roughly $4.85 billion going back to shareholders each year. The dividend accounts for a smaller share of that. Most of the return comes through buybacks.
In practical terms, the dividend is the steady, predictable base. Buybacks are the variable layer on top, sized to market conditions and balance sheet priorities. In the second half of FY25 alone, SPGI authorized and executed accelerated share repurchase (ASR) programs totaling several billion dollars while simultaneously returning capital through regular dividends. That’s a Phase 4 capital allocation program running at full capacity.
The dividend
SPGI pays a quarterly dividend of $0.96 per share, which, annualized, amounts to $3.84. At the current stock price near $428, that’s a yield of roughly 0.9%. For investors focused on current income, the yield is low. For investors focused on dividend growth and total return, the picture is different.
SPGI has raised its dividend every year for over 50 consecutive years. That makes it one of the longest-running dividend growth records in the market and a confirmed Dividend Aristocrat. The average compound annual growth rate (CAGR) of the dividend since 1974 has run above 9%.
What that growth means in practice: an investor who bought SPGI five years ago is earning a yield-on-cost well above the current headline yield. The dividend at purchase was smaller, but the stock’s price has risen and the dividend has grown. That’s the compounding dynamic that makes dividend growth stocks worth understanding.
Is the dividend safe?
Three tests.
Earnings payout ratio: SPGI’s earnings-based payout ratio sits around 26%. That’s low. A payout ratio below 60% is generally considered healthy, it means the company retains the majority of earnings to reinvest and still has room to absorb an earnings decline without cutting the dividend.
FCF payout ratio: This is the better test for dividend safety. The dividend costs approximately $1.2 billion per year (annualized to $3.84 per share, based on a share count of roughly 320 million). Against $5.6 to $5.8 billion in adjusted FCF, that’s a FCF payout ratio of approximately 21%. The dividend consumes about one dollar of every five generated in free cash flow. That’s an exceptionally well-covered dividend.
Debt coverage: The balance sheet carries debt from the IHS Markit acquisition, but FCF more than covers interest obligations. Financial health in Stock Simplifier came back Healthy, which is consistent with the underlying numbers.
By any standard measure, SPGI’s dividend is safe. The payout ratios are low, FCF generation is strong, the business is growing, and management has demonstrated a 50-plus-year commitment to raising payments each year.
Buybacks: Are they adding value?
The buyback question matters because companies that repurchase shares at inflated prices destroy value for long-term holders. Shares bought back at 50x earnings shrink the share count on paper but do nothing for per-share value.
For SPGI, buybacks over the past two years have been executed at prices meaningfully below the prior peak and at P/FCF multiples below the company’s historical average. That’s the right time to buy. Management is not repurchasing shares because it has nothing better to do with the money; it’s repurchasing them because the stock appears undervalued relative to intrinsic value.
The accelerated share repurchase programs authorized in the second half of FY25 reinforced that signal. Management was committed to returning more capital at a time when the stock had pulled back. That’s capital allocation discipline, not capital allocation theater.
The complete picture
Our Stock Simplifier run-through gave this analysis a 4.2 composite score and a Buy verdict. The underlying data supports it. SPGI is a Phase 4 capital-return machine with a wide and growing moat, a well-covered dividend with a 50-plus-year growth streak, and a valuation below its historical average. The FCF payout ratio of roughly 21% means the dividend has significant room to continue growing even if business conditions soften.
This is not a high-yield stock. It is a high-quality compounder with a growing dividend, active buybacks, and a business that has demonstrated the ability to raise prices, retain customers, and generate cash across multiple economic cycles. For investors building a portfolio around dividend growth and business quality, SPGI belongs on the list.
The Honest Take
Stock Simplifier is a great tool, I think we showcased that, but it does have a few kinks to work out. For example, the signup page is a bit clunky, and the data takes a minute or two to load for some of the more obscure companies. And the other kink in the road is that not every global company is represented yet. So, for those of you outside the US wanting to analyze companies in your backyard, you might not be able to yet.
Stock Simplifier is still in Beta mode, meaning it is still improving and growing. This is the worst it will ever be, and it’s already a fantastic tool. It can help save tons of time analyzing the companies you want to buy. Peter Lynch once said, “Whoever turns over the most rocks wins the game.” (paraphrasing here).
I ran the initial analysis for this article using Stock Simplifier, which covers 1,000-plus companies using live Fiscal.ai data. If you want to run your own structured analysis on stocks you own or are watching, the link below is where to start. Join the waitlist below.
This is not financial advice. Do your own research before making any investment decision.
Affiliate disclosure: This post contains affiliate links. If you join Long-Term Mindset through my link, I earn a commission at no additional cost to you.