
ROIC vs. WACC — How Value Creation Really Works

Is that fast-growing company in your portfolio actually creating value, or is it just burning cash to get bigger? The answer lies in a simple but powerful framework that separates true economic winners from the rest. Understanding the spread between Return on Invested Capital (ROIC) and the Weighted Average Cost of Capital (WACC) is the key to identifying durable, compounding businesses.
TL;DR
Value Creation's Core Formula: A company creates value only when its Return on Invested Capital (ROIC) is greater than its Weighted Average Cost of Capital (WACC).
ROIC > WACC is Not Enough: The magic happens when a company can reinvest a significant amount of capital back into the business at these high rates of return.
ROIC Explained: It’s the truest measure of operational efficiency, showing how much profit a company generates for every dollar of capital invested in its business.
WACC Explained: This is the minimum return a company must generate to satisfy its investors (both shareholders and lenders). It’s the "cost of doing business."
Focus on the Trend: A single year's ROIC can be misleading. Analyze the 5-10 year trend to understand the durability of a company's competitive advantage or "moat."
Per-Share Thinking is Crucial: Value creation must ultimately translate to higher free cash flow and earnings on a per-share basis.
Why It Matters: Separating Growth from Value
In the public markets, growth often gets all the attention. Revenue growth, user growth, earnings growth—these are the metrics that dominate headlines. But growth by itself is meaningless if it doesn't generate a return above its cost.
Many investors get this wrong. They chase fast-growing companies without asking the crucial question: is this profitable growth? A company can grow revenues by 50% a year, but if it spends $1.20 to generate every $1.00 of future profit, it's actively destroying shareholder value. This is surprisingly common, especially in capital-intensive or highly competitive industries.
The ROIC vs. WACC framework cuts through the noise. It’s a universal acid test for corporate performance. It forces you to think like a business owner and ask:
How good are we at investing our money? (ROIC)
What’s the minimum return we need to justify those investments? (WACC)
Understanding this dynamic helps you avoid "value traps" and identify the elite businesses—the true compounding machines—that build lasting wealth.
Core Concepts: The Value Creation Engine
At its heart, a business takes capital from investors (debt and equity) and reinvests it into assets (factories, software, R&D) to generate cash flow. The ROIC vs. WACC framework measures how well it performs this fundamental task.
ROIC: The Measure of Business Quality
Return on Invested Capital tells you how efficiently a company is using its capital to generate profits. A higher ROIC indicates a more profitable business.
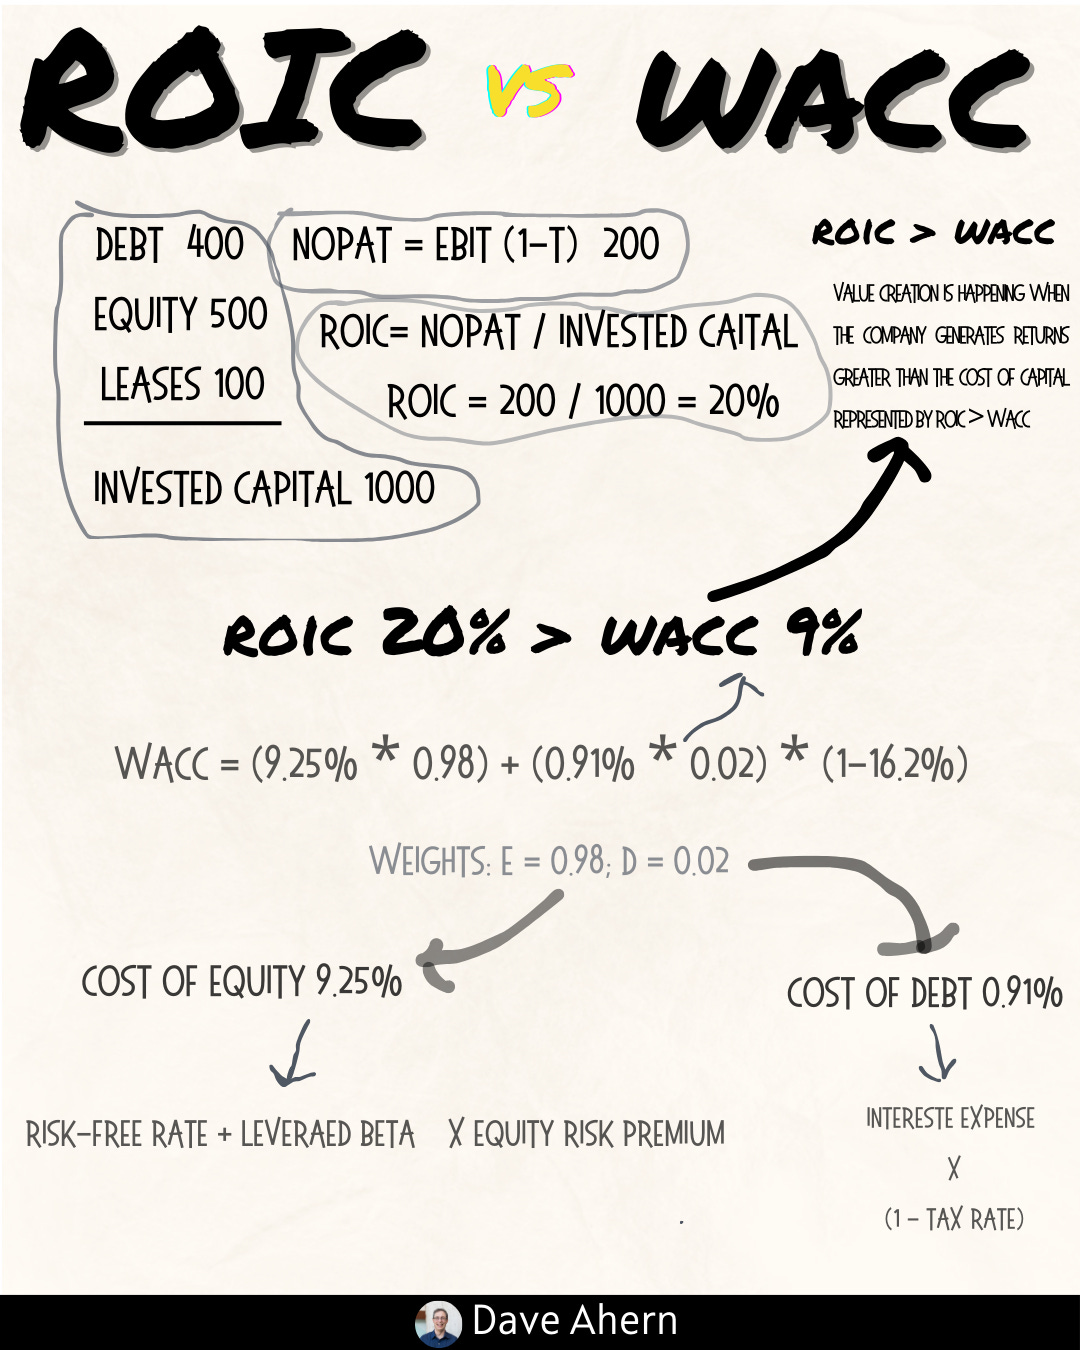
The formula is:
ROIC = NOPAT / Invested Capital
NOPAT (Net Operating Profit After Tax): This represents the company's operating profit (EBIT) after deducting taxes. It shows the pure, unlevered profit from the core business operations.
Invested Capital: This is the total amount of money raised from investors that is currently deployed in the business. It's typically calculated as (Total Debt + Total Equity - Cash & Equivalents).
Think of it this way: if a company has $1 billion of Invested Capital and generates $200 million in NOPAT, its ROIC is 20%. For every dollar invested, it's earning 20 cents in operating profit per year.
WACC: The Hurdle Rate for Value
Weighted Average Cost of Capital is the blended cost of the capital a company uses. It’s the average rate of return it must pay to its debt holders (interest) and equity holders (the return they expect for their risk).
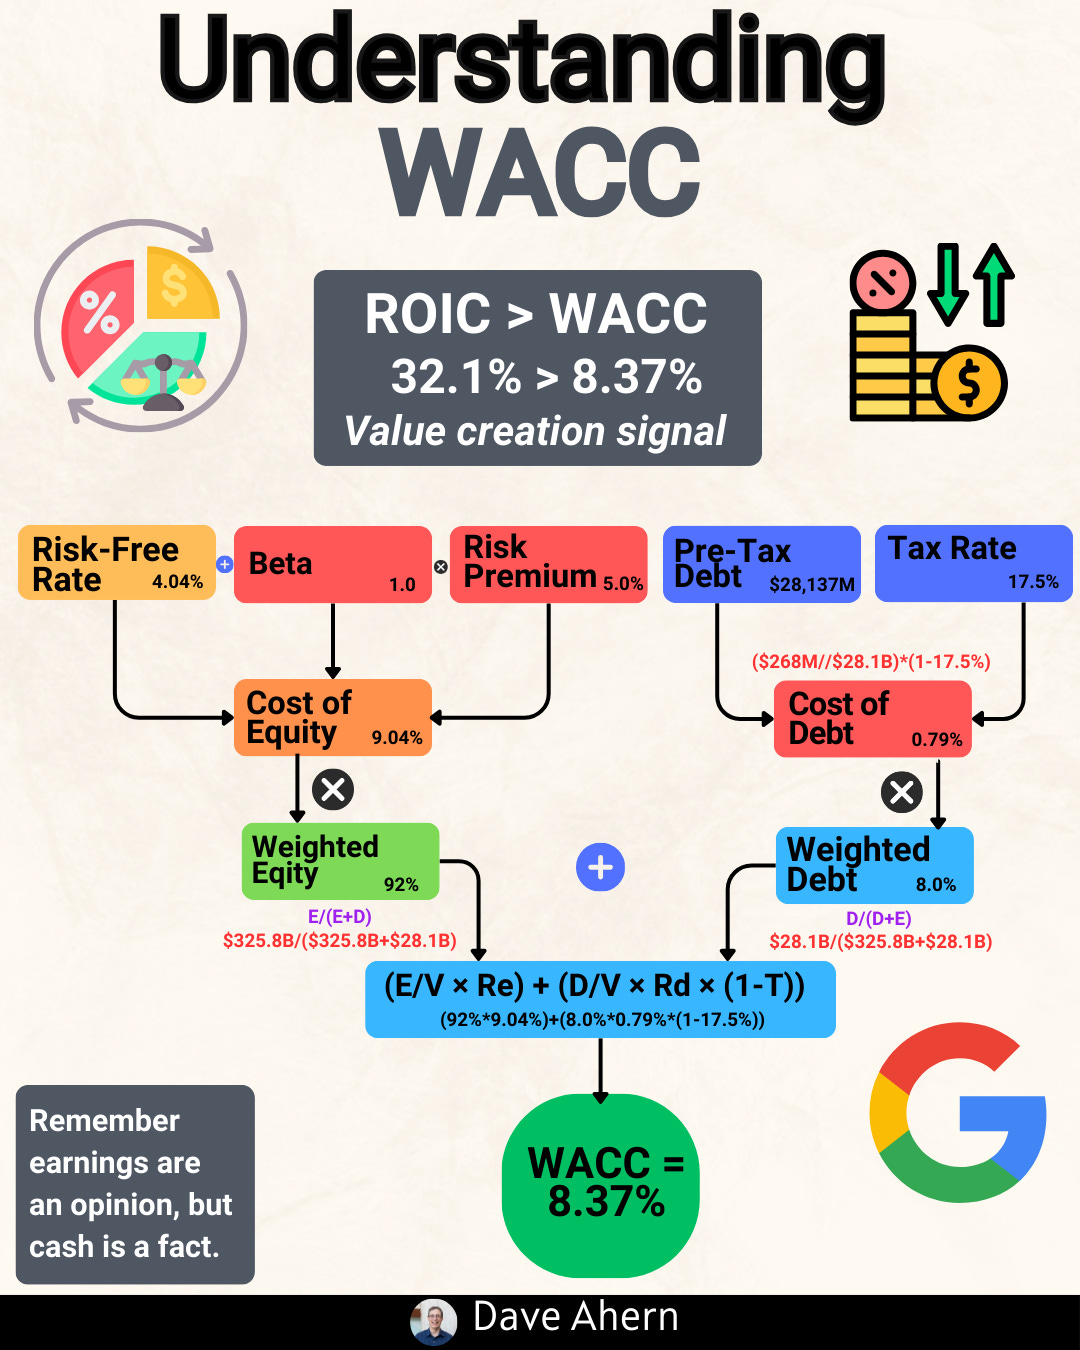
If a company’s WACC is 10%, it needs to generate at least a 10% return on its investments just to break even for its investors. This is the "hurdle rate" that any new project or investment must clear.
The Golden Spread: ROIC - WACC
The difference, or "spread," between ROIC and WACC is the measure of true economic profit.
ROIC > WACC: The company is creating value. Every dollar invested earns more than it costs.
ROIC < WACC: The company is destroying value. It would be better off returning capital to shareholders than reinvesting it.
ROIC = WACC: The company is treading water, earning just enough to cover its capital costs.
The best businesses in the world maintain a wide and durable spread for many years.
Worked Example: Nvidia (NVDA)
Nvidia, a leader in accelerated computing, provides a powerful example of immense value creation driven by an extraordinary ROIC. The company designs GPUs (Graphics Processing Units) and related software for the gaming, data center, and automotive markets. This is a business built on deep R&D investment and intellectual property.
Nvidia's moat comes from its parallel computing platform, CUDA, which has created massive switching costs for developers, and its relentless innovation, which has kept it at the forefront of key secular trends like Artificial Intelligence.
Let's look at the numbers.
As the chart shows, Nvidia's ROIC has been well above its WACC for the last decade. This positive spread means every dollar of capital it has retained and reinvested—primarily in R&D and strategic acquisitions—has generated returns far in excess of its cost.
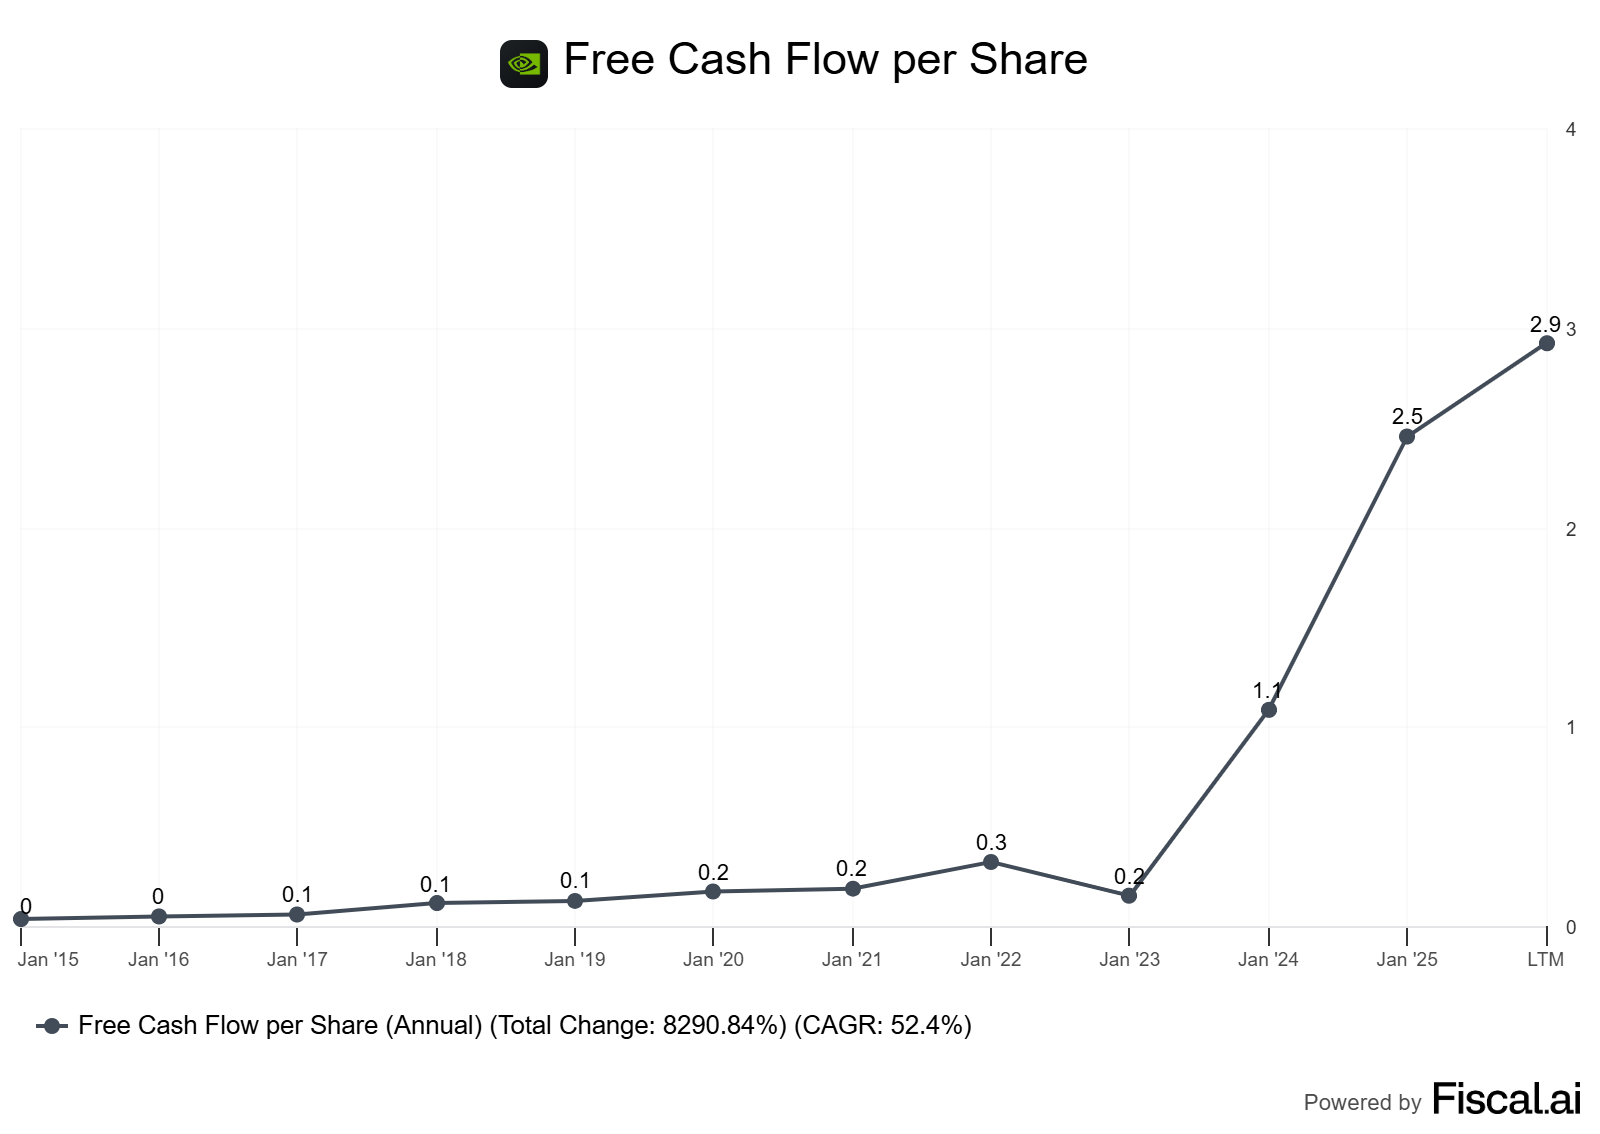
Cash Flow and Per-Share Metrics
A high ROIC should translate into strong free cash flow (FCF). FCF is the cash left over after all operating expenses and capital expenditures are paid. It's the cash available to reward shareholders through dividends and buybacks.
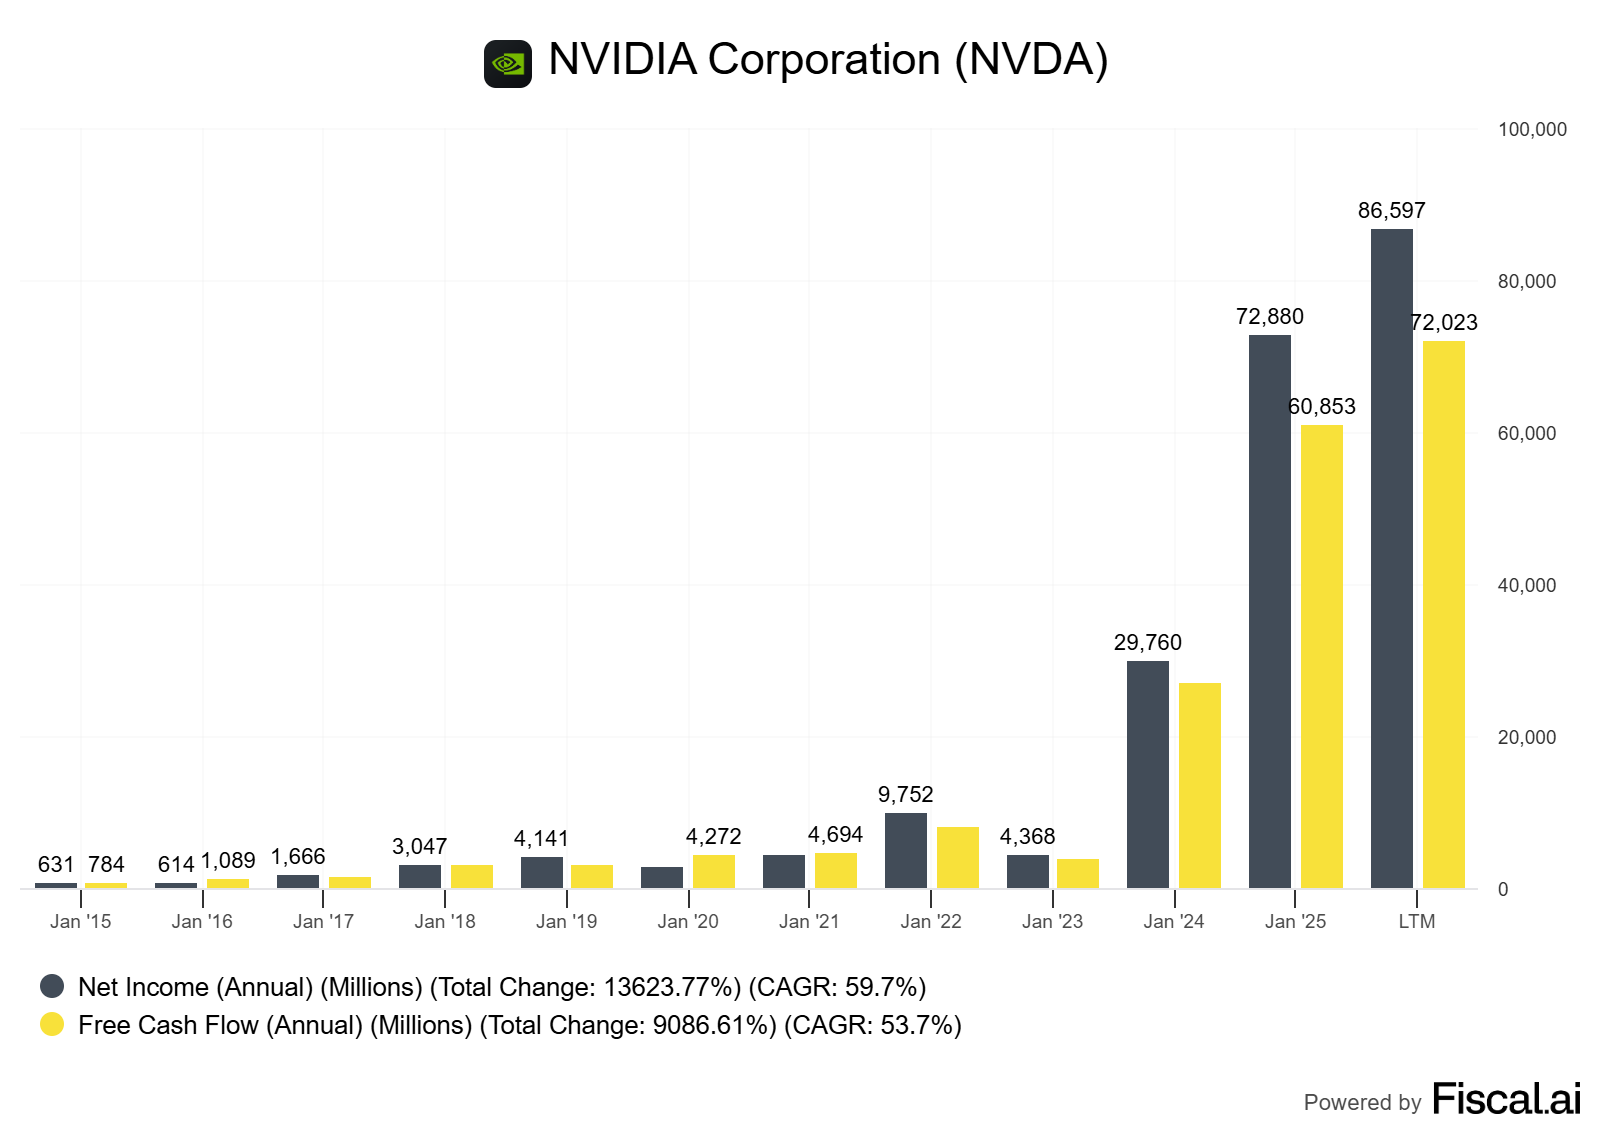
Nvidia's ability to convert its high returns into prodigious free cash flow, and then translate that into FCF per share, is the hallmark of a quality compounder. They haven't just grown; they've created immense value for each individual owner of the business.
How to Do This Yourself: A Step-by-Step Guide
You don't need a complex model to do this analysis. Here’s a practical guide:
Gather Your Data (from the 10-K/20-F):
For NOPAT: Find "Operating Income" (or EBIT) on the Income Statement. Find the "Effective Tax Rate" in the tax footnote. Calculate:
NOPAT = Operating Income * (1 - Tax Rate).For Invested Capital: On the Balance Sheet, find
Total EquityandTotal Debt(both short-term and long-term). Also, findCash and Cash Equivalents. Calculate:Invested Capital = Total Equity + Total Debt - Cash. Use a two-year average for a smoother, more representative figure.
Calculate ROIC:
Divide your NOPAT by your average Invested Capital.
Do this for the last 5–10 years to see the trend. Is it stable, rising, or falling?
Estimate WACC:
This is the trickiest part. For a quick estimate, many investors use a standard hurdle rate like 10%.
For a more precise figure, you can build it up:
WACC = (Weight of Equity * Cost of Equity) + (Weight of Debt * Cost of Debt * (1 - Tax Rate)). You can find data for beta (to calculate cost of equity) and interest rates from financial data providers.Decision Rule: Don't get paralyzed by precision. The key is whether ROIC is comfortably above WACC. A 12% ROIC vs. a 10% WACC is good; a 30% ROIC vs. a 10% WACC is world-class.
Check the Trend and Spread:
Plot the 10-year history of ROIC and WACC.
Decision Rule: Prefer companies with a sustained ROIC-WACC spread of over 5%. Look for stability or expansion in the spread, which indicates a strengthening moat.
Pitfalls and False Positives
The "One-Year Wonder": A company might have a huge ROIC in a single year due to an asset sale or a cyclical peak. Always analyze the 5-10 year trend to smooth out the noise.
Aggressive Accounting: Companies can temporarily boost ROIC by underinvesting in the business (e.g., cutting R&D or maintenance capex) or using off-balance-sheet financing. Cross-check with FCF conversion.
Good Company, Bad Price: A high-ROIC business is not automatically a good investment. Valuation matters. If everyone knows it's a great business, the price may already reflect that, limiting your future returns.
Ignoring Reinvestment: A high-ROIC business that cannot reinvest its capital (e.g., a mature, no-growth company) is less valuable than one that can. The ability to redeploy capital at high rates is the engine of compounding.
Checklist: ROIC vs. WACC Analysis
Calculate 10-Year ROIC Trend: Is it consistently above 15%?
Estimate WACC: Is it below 10-12%?
Confirm a Wide Spread: Is ROIC at least 5 percentage points higher than WACC?
Check for Durability: Has the spread been stable or widening over time?
Verify FCF Conversion: Does Net Income consistently convert to Free Cash Flow?
Analyze Per-Share Metrics: Is FCF/share rising? Is the share count stable or decreasing?
Assess Reinvestment Runway: Does the company have opportunities to reinvest capital at this high ROIC?
Mini-FAQ
1. Why use ROIC instead of ROE (Return on Equity)?
ROE can be artificially inflated with debt (leverage). ROIC measures the return on all capital, giving you a cleaner view of underlying business profitability, independent of its financing decisions.
2. What is a "good" ROIC?
Context matters, but as a general rule of thumb, a consistent ROIC above 15% is considered very good. Anything consistently above 20% is often a sign of an elite business with a strong competitive advantage.
3. Can a company have a high ROIC but be a bad investment?
Absolutely. If a company has a high ROIC but no opportunities to reinvest its cash flow, its growth will be limited. Furthermore, if its stock price is too high, your future returns as an investor may be low, even if the business itself is excellent.
4. How does this apply to unprofitable tech companies?
For early-stage, unprofitable companies, traditional ROIC is not useful. You have to focus on unit economics and the potential for future ROIC once the business reaches scale. Ask: "If this company were mature, what would its margins and returns look like?"
5. Where do investors find the data to calculate this?
The best sources are a company's official filings: the annual report (10-K for US companies, 20-F for international companies) and quarterly reports (10-Q). These are available on the company's investor relations website or the SEC's EDGAR database.
Glossary
ROIC (Return on Invested Capital): The profit a company earns each year per dollar of capital invested in the business.
WACC (Weighted Average Cost of Capital): The blended minimum return a company must pay its lenders and shareholders.
NOPAT (Net Operating Profit After Tax): A company's operating profit adjusted for taxes; shows profitability from core operations.
Invested Capital: The total pool of money (debt and equity) used to fund the company's operations.
Economic Moat: A sustainable competitive advantage that protects a company's profits from competitors.
Free Cash Flow (FCF): The cash generated by the business after accounting for all operational and investment expenses.
FCF Conversion: The ratio of Free Cash Flow to Net Income; a measure of earnings quality.
Further Reading
Expectations Investing by Michael Mauboussin and Alfred Rappaport (2021)
The Little Book That Builds Wealth by Pat Dorsey (2008)
Credit Suisse - The Base Rate Book (2016)
References
Nvidia Corporation, Form 10-K for fiscal year ended January 28, 2024. (as of August 28, 2025)
Damodaran, Aswath. "Cost of Capital by Sector (US)." Stern School of Business. (as of January 2025)
Educational content, not investment advice.
Hi, Dave! Great article. In Brazil, the concept of "ROIC vs. WACC" is still in its infancy. Investors, especially individual investors, don't pay attention to this crucial metric. We've developed a platform for studying and analyzing Brazilian companies, focusing on developing a method for analyzing value generation. It's much better than earnings per share and other common and ineffective indicators.
I'd like to invite you to see this analysis of Ambev (ABEV3 - ABEV): https://apolovalueinvesting.com.br/experimente