
Reverse-DCF Deep Dive: Can Microsoft Sustain Its High Returns?

When you buy a great company like Microsoft, you’re not just paying for current earnings; you’re paying for future capacity to invest at very high returns.
But how much growth is already baked into the stock?
By doing a reverse discounted cash-flow (DCF) anchored in Microsoft’s quality fundamentals, like its ROIC, reinvestment ability, and capital allocation, we can back out the “implied growth” the market expects, and assess whether it’s realistic.
TL;DR
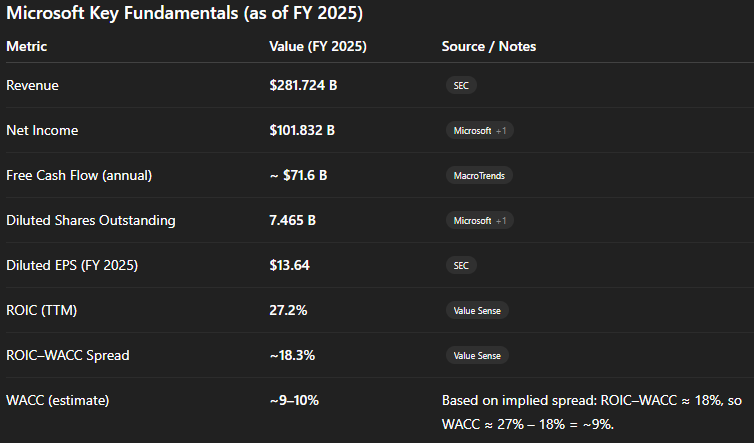
Microsoft’s ROIC (~27%) significantly exceeds its estimated WACC (~10%), implying strong value creation. (Value Sense)
Despite the capital intensity (massive CapEx), its free cash flow (FCF) remains robust (e.g., ~$71.6B in FY 2025). (MacroTrends)
A reverse-DCF based on these quality metrics suggests that a high bar of growth is “priced in.”
Key risks: slowing reinvestment returns, rising capital intensity, or margin compression could structurally reduce the implied runway.
For quality investors, the goal isn’t just to model growth — but to sanity-check whether Microsoft can sustain reinvestment at returns that justify its valuation.
Why It Matters
In growth investing, it’s easy to get seduced by top-line momentum. But quality investing reminds us that not all growth is equal: what matters is return on the capital you invest. Just because a company is reinvesting heavily doesn’t mean it’s creating value, it must do so at returns above its cost of capital (WACC).
Many investors overestimate how long a company can reinvest at high returns, or how durable its moats really are. A reverse DCF grounded in fundamental quality — not just consensus growth rates — can surface whether the market is expecting more from the business than it can realistically deliver. For a company like Microsoft, which sits near the top of the quality pile, this kind of analysis helps answer: is the premium justified?
Core Concepts in Quality Investing
ROIC vs WACC and Value Creation
ROIC (Return on Invested Capital) measures how efficiently a business turns capital (equity + debt) into profits (NOPAT – Net Operating Profit After Taxes).
WACC (Weighted Average Cost of Capital) represents the cost to finance that capital (a mix of debt and equity).
If ROIC > WACC, the business creates economic value: every dollar reinvested earns a spread. Over time, this compounding drives real shareholder value.
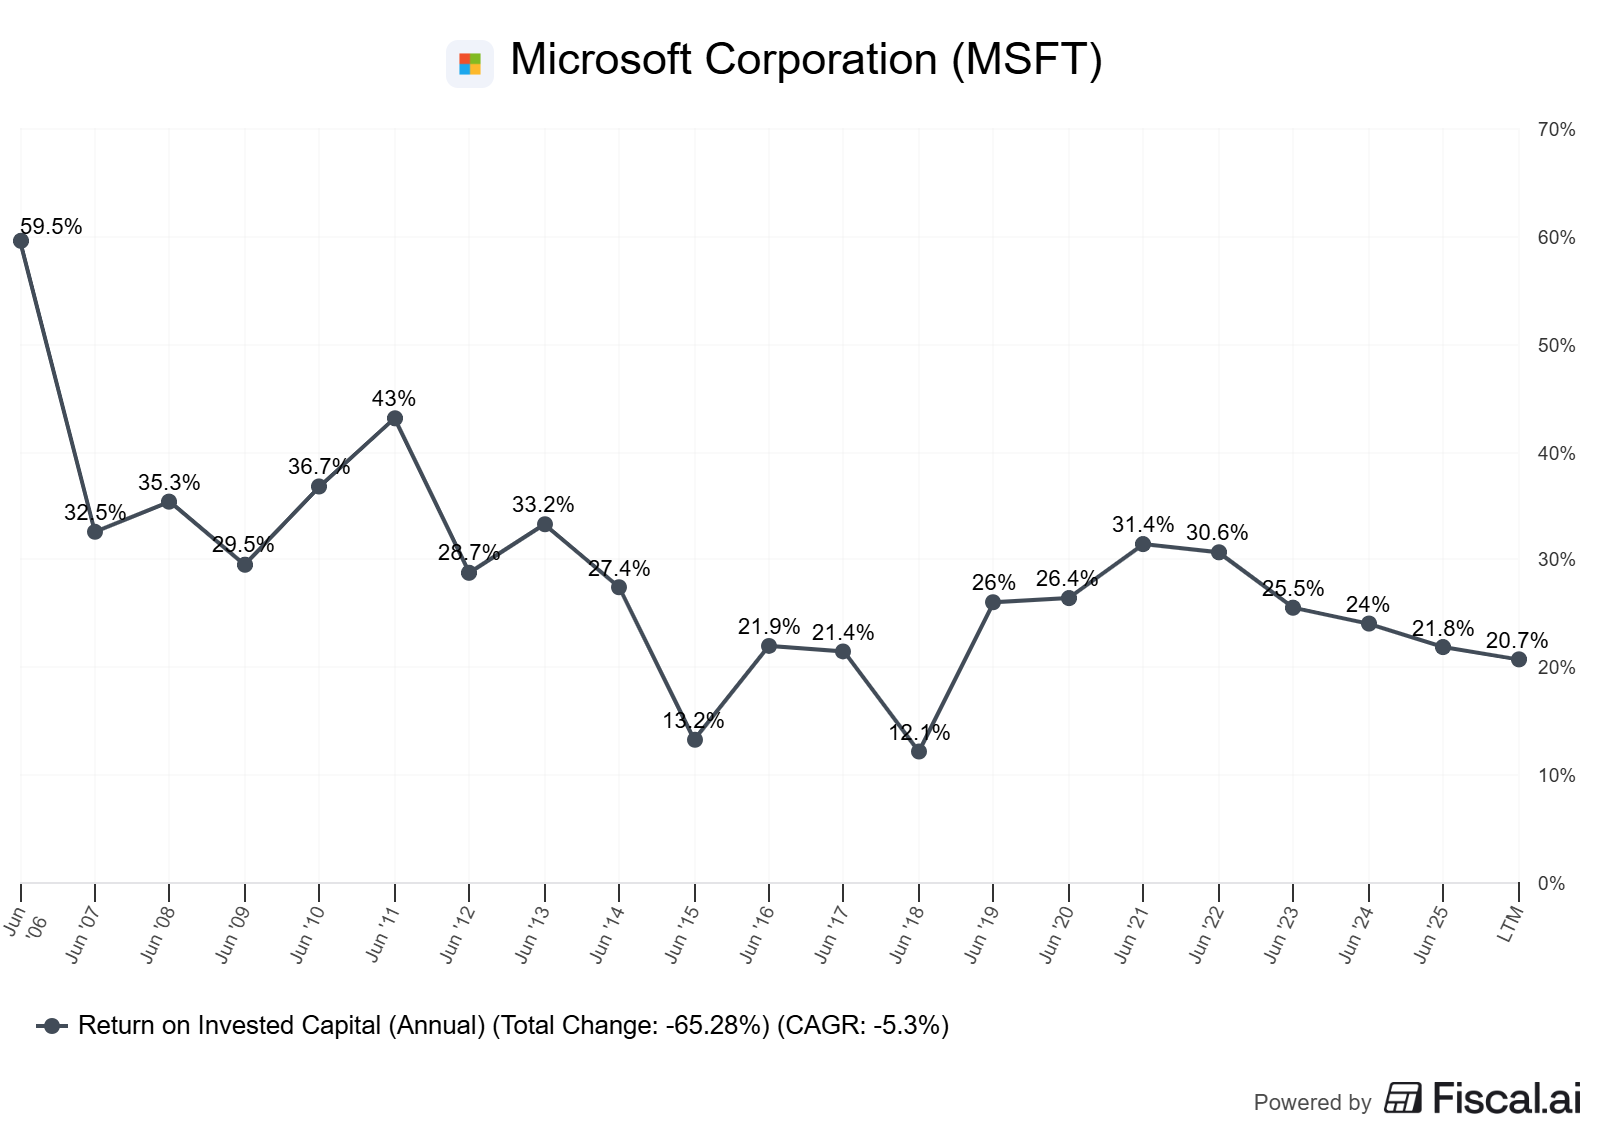
In Microsoft’s case, platforms like ValueSense report a trailing-12-month ROIC of ~27.2%. (Value Sense) Meanwhile, its ROIC–WACC spread (i.e., how much above its cost of capital it earns) is around 18.3% LTM per ValueSense. (Value Sense)
That’s a very wide spread, implying Microsoft is not just profitable — it’s highly efficient in capital use.
Reinvestment Runway & Capital Intensity
A high-return business can only drive growth if it has opportunities to reinvest. The “reinvestment runway” refers to the pool of incremental investments available (CapEx, R&D, working capital) that can continue to generate returns above WACC.
But not all growth requires the same capital intensity: cloud data centers, for instance, are capex-heavy, while software is less so.
Quality investors assess not just whether the company can invest, but whether it should, and at what return.
Unit Economics & Per-Share Metrics
Understanding how capital increments scale per share is vital. For public companies, dilution (e.g., from stock-based compensation, SBC) and repurchases matter.
Key per-share metrics: FCF per share, EPS, shares outstanding, and how these evolve with reinvestment.
Good capital allocators will either return excess cash (buybacks/dividends) or only reinvest when returns are compelling.
Moat Durability
A moat is a structural advantage (e.g., network effect, switching cost, scale).
Evidence of a moat: persistent high margins, stable or rising ROIC, low churn, ability to price above commodity alternatives.
But moats are not permanent: reinvestment at lower returns, competition, or disruption can erode them.
Quality investing asks: Is the moat just a marketing pitch, or does real economic protection back it?
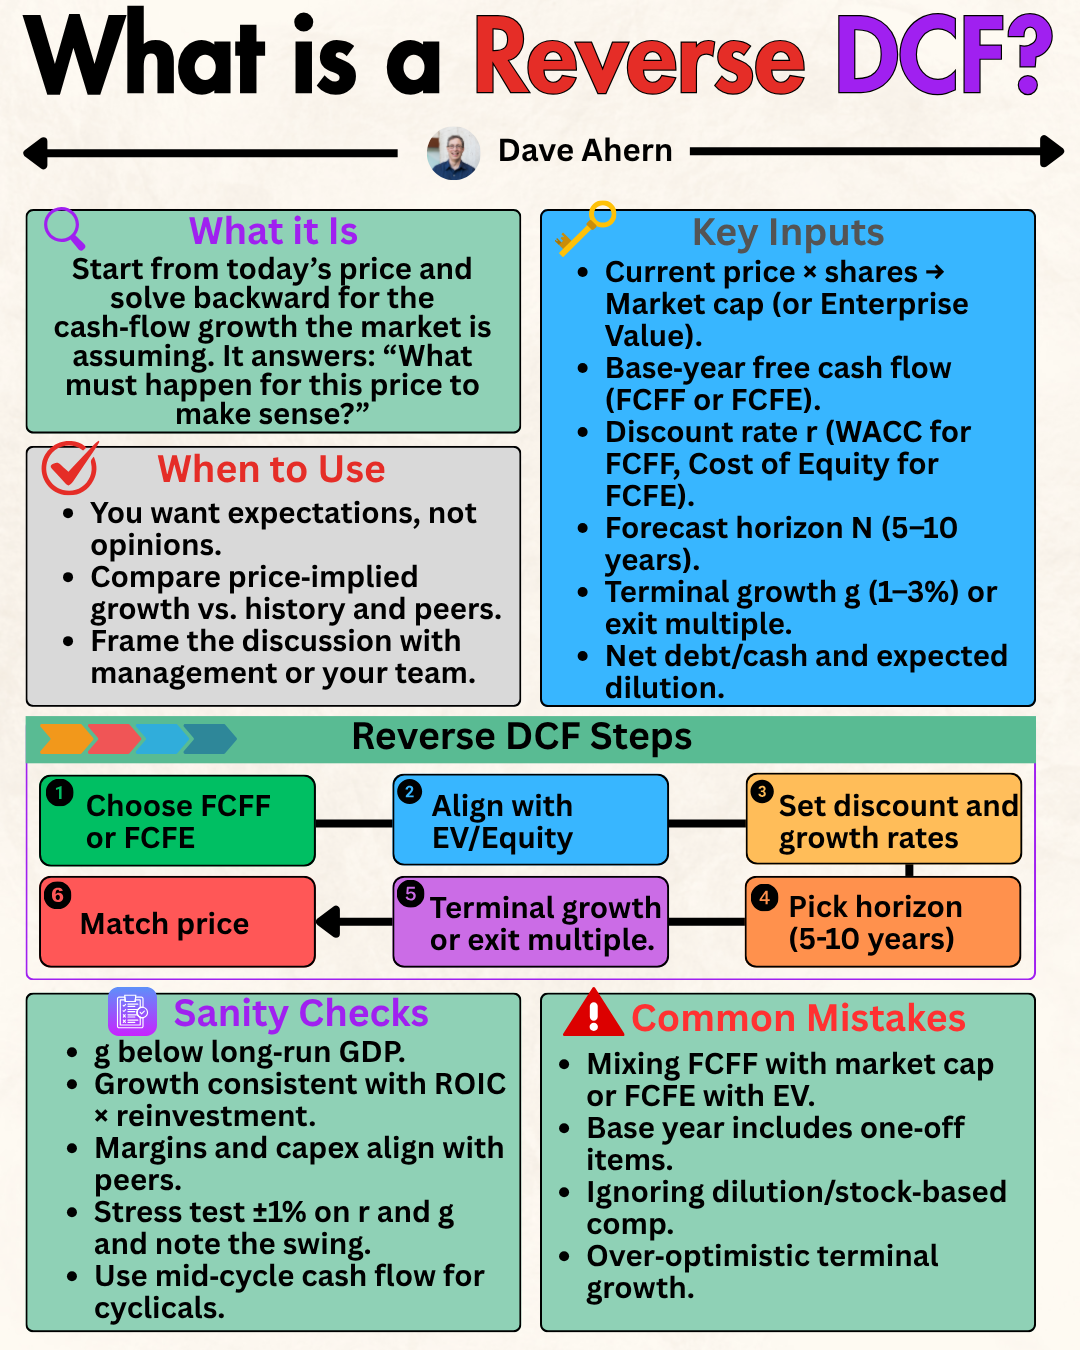
Valuation Drivers & Reverse-DCF Logic
A traditional DCF starts with growth and projects FCF forward; a reverse DCF starts from the current price and works backward to infer the implied growth, given assumptions on reinvestment and returns.
In a quality approach, you anchor growth assumptions in historical ROIC, reinvestment rate, and capital returns, not just analyst forecasts.
Worked Example: Microsoft (MSFT)
Let’s apply these concepts to Microsoft using publicly reported data.
Microsoft Key Fundamentals (as of FY 2025)
Reverse-DCF: Inferring Implied Growth
Here’s a simplified reverse-DCF in conceptual steps (numbers illustrative, but grounded in Microsoft’s scale):
Base FCF (today): Use the most recent FCF: ~$71.6B.
Reinvestment Rate: Estimate what portion of earnings Microsoft reinvests. Suppose Microsoft reinvests 40% of its FCF annually (in CapEx, working capital, R&D).
Return on New Investments: Assume it reinvests at its historical ROIC (~27%).
Growth from reinvestment: Growth = Reinvestment Rate × (ROIC – WACC). With 40% reinvestment and spread ~18%, growth rate ≈ 0.4 × 0.18 = 7.2% per year from reinvested capital.
Terminal Growth Rate: Assume long-term terminal growth (beyond explicit forecast) is 3% (GDP-like).
Discount Rate: Use WACC (~9–10%).
Per-Share Value: Discount FCF to present value, sum reinvestment-driven growth zone + terminal value, divide by shares (~7.465B).
If you do that, the model may imply that the current stock price already embeds mid-single-digit real growth, but with a heavy reliance on Microsoft maintaining very disciplined high-return reinvestment.
Interpretation & Caveats
Strength: Microsoft’s implied growth is reasonable if it can continue to reinvest ~40% of FCF at very high returns.
Risk: If reinvestment rate rises (e.g., huge CapEx for AI/data centers) but returns fall (due to competition, commoditization), the implied growth collapses.
Alternative Interpretation: If Microsoft weakened its ROIC gradually (say, through capital intensity creep), its valuation could compress even with flat revenue.
This reverse-DCF doesn’t assume hyper-growth; instead, it embeds quality: strong returns, disciplined reinvestment, and durable capital allocation.
How to Do This Yourself
Here’s a step-by-step guide for applying this analysis to Microsoft — or any company:
Gather data
Download the latest annual report / 10-K (e.g., Microsoft’s June 30, 2025 Form 10-K). (SEC)
Extract historical net income, operating cash flow, CapEx, and shares outstanding.
Use a financial data platform (e.g., ValueSense, Gurufocus, fiscal.ai) to find ROIC and WACC, or compute it if you’re comfortable.
Calculate base FCF per share
FCF = Operating Cash Flow – CapEx. Use trailing twelve months (TTM).
Divide FCF by diluted shares to get FCF per share.
Estimate reinvestment rate
Reinvestment rate = (Reinvested capital) / (FCF). Reinvested capital could be CapEx + change in working capital – non-cash items, etc.
Model returns on reinvestment
Assume a return equal to historical ROIC.
Compute the spread = ROIC – WACC.
Build forward cash flows (reverse DCF)
Forecast FCF growth for a period (e.g., 5–10 years) based on reinvestment and spread.
Then apply a terminal growth rate for the perpetuity phase.
Discount the cash flows
Use WACC as the discount rate.
Sum PV of forecast FCF + terminal value.
Divide by shares outstanding
Use diluted shares. For Microsoft: ~7.465B from its FY 2025 numbers. (Microsoft)
Run sensitivity
Vary reinvestment rate (e.g., 30–50%) and return-on-new-investment (e.g., 22–30%) to see how implied growth shifts.
Compare to consensus
Compare your “implied growth” with analyst growth estimates, long-term cloud growth forecasts, etc.
Pitfalls & False Positives
ROIC calculation traps: Different sources compute ROIC differently. Make sure you understand how “invested capital” is defined (some include excess cash, others don’t).
WACC estimation risk: Estimating WACC is tricky — small errors in capital structure, beta, or cost of debt can materially affect implied growth.
Terminal assumptions: A low terminal growth rate underestimates risk; a too-high rate overstates value.
Change in reinvestment behavior: A company may shift from “reinvest everything” to “return cash,” or vice versa, which breaks your model.
Dilution risk: Stock-based compensation or future capital raises can increase share count, eroding per-share FCF.
Macroeconomic shifts: Rising interest rates, inflation, or competitive dynamics can compress reinvestment returns over time.
Checklist / One-Pager
Check LTM ROIC and compare to WACC
Estimate reinvestment rate (CapEx + working capital)
Calculate “growth from reinvestment” = reinvestment rate × (ROIC – WACC)
Build a reverse-DCF: forecast FCF growth, build terminal value, discount by WACC
Compute per-share implied value using diluted shares
Stress-test with different reinvestment rates and return assumptions
Compare implied growth vs consensus and business risks
Revisit regularly: every earnings / capital-allocation update
Glossary
ROIC (Return on Invested Capital): A measure of how efficiently a company turns capital into profits.
WACC (Weighted Average Cost of Capital): The average return required by capital providers (debt + equity).
Reinvestment Rate: Portion of cash flow that’s re-deployed into the business (CapEx, working capital, R&D).
Reverse DCF: A valuation technique that infers implied growth based on current price, given assumptions on reinvestment and return.
Economic Spread: The difference between ROIC and WACC; a gauge of value creation.
Terminal Growth Rate: The assumed perpetuity growth rate of cash flows beyond the explicit forecast period.
References
Microsoft Form 10-K for period ended June 30, 2025. (SEC)
Microsoft FY 2025 Q4 cash flows (Net Income, Adjustments). (Microsoft)
Macrotrends – Microsoft free cash flow history. (MacroTrends)
Macrotrends – Microsoft shares outstanding history. (MacroTrends)
ValueSense – MSFT Return on Invested Capital. (Value Sense)
ValueSense – MSFT ROIC minus WACC spread. (Value Sense)
ValueSense – MSFT capital allocation overview. (Value Sense)
Educational content, not investment advice.