
Normalizing Through Cycles: Why One Year of Margins Can Mislead You (and How Mid-Cycle Analysis Fixes It)

If you valued TSMC based on its 2022 margins, you would have concluded it was one of the most profitable companies on Earth. If you had used 2019 margins instead, you might have hesitated to buy it. Same company. Same competitive advantages. Wildly different conclusions.
That’s the trap of cyclical businesses. And in this article, I’ll show you exactly how to avoid it by calculating mid-cycle margins, the single most important normalization technique for valuing any company whose profits swing with industry cycles.
The Problem: Snapshots Lie
Most investors know they shouldn’t value a company based on a single quarter. But surprisingly few extend that logic to full-year financials. When a semiconductor company reports its annual results, those numbers feel authoritative. They come from audited SEC filings. They’re precise to the decimal.
But precision is not the same as accuracy.
Semiconductor companies ride massive demand cycles. When smartphones, PCs, and data centers are all upgrading simultaneously, foundries and chipmakers operate at full utilization. Margins expand. When the cycle turns (as it did in 2019 and again in 2023), utilization drops, pricing softens, and margins compress. The underlying business hasn’t changed, but the financial snapshot has shifted dramatically.
This is where mid-cycle margin analysis comes in. Instead of anchoring to a single year’s profitability, you calculate what the company earns across an entire cycle, then use that “normalized” figure as the foundation for your valuation.
What Are Mid-Cycle Margins?
Mid-cycle margins represent the average profitability a company generates over a full business cycle, capturing both peaks and troughs in demand. The concept is straightforward: add up the margins across several years that span at least one full up-and-down cycle, then divide by the number of years.
The keyword is “cycle.” You’re not just averaging for the sake of averaging. You’re deliberately including at least one period of above-trend profitability and one period of below-trend profitability so they balance each other out.
For semiconductors, cycles typically run 3 to 5 years from peak to peak. That means a 10-year window typically captures two or more full cycles, providing a robust mid-cycle estimate.
Here’s the formula:
Mid-Cycle Operating Margin = Sum of Annual Operating Margins / Number of Years
Simple math, but it requires discipline. You need enough years to smooth the noise, and you need to pull the data from verified sources. Let’s do exactly that with TSMC.
TSMC: A 10-Year Margin Map
Taiwan Semiconductor Manufacturing Company (TSMC) files its annual reports as a 20-F with the U.S. SEC (the equivalent of a 10-K for foreign private issuers). I pulled the gross and operating margin figures directly from TSMC’s Annual Reports hosted on investor.tsmc.com for each fiscal year from 2014 through 2023.
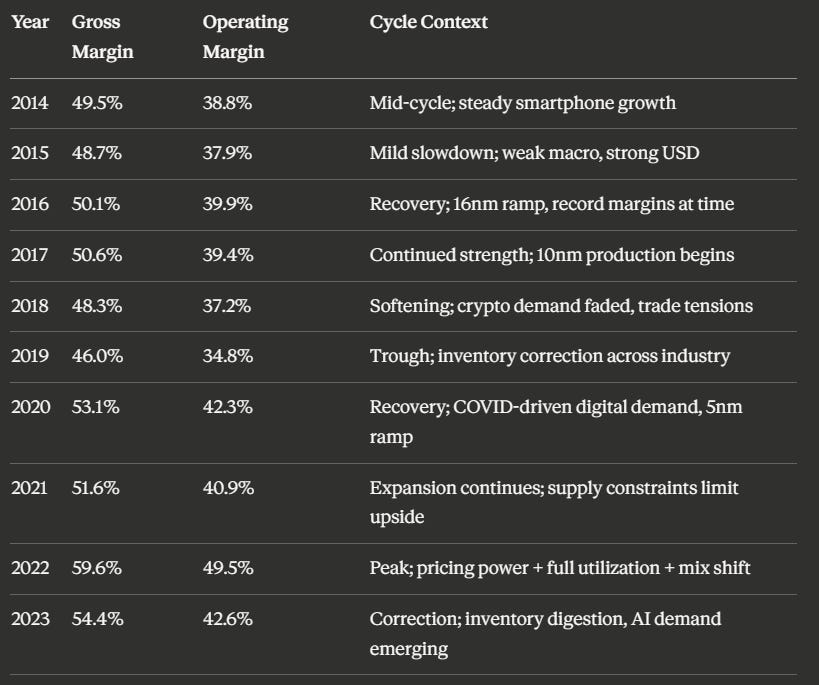
Source: TSMC Annual Reports (20-F filings), investor.tsmc.com. Each year references the Letter to Shareholders section reporting full-year margins.
Calculating TSMC’s Mid-Cycle Margins
10-Year Average Gross Margin (2014-2023): (49.5 + 48.7 + 50.1 + 50.6 + 48.3 + 46.0 + 53.1 + 51.6 + 59.6 + 54.4) / 10 = 51.2%
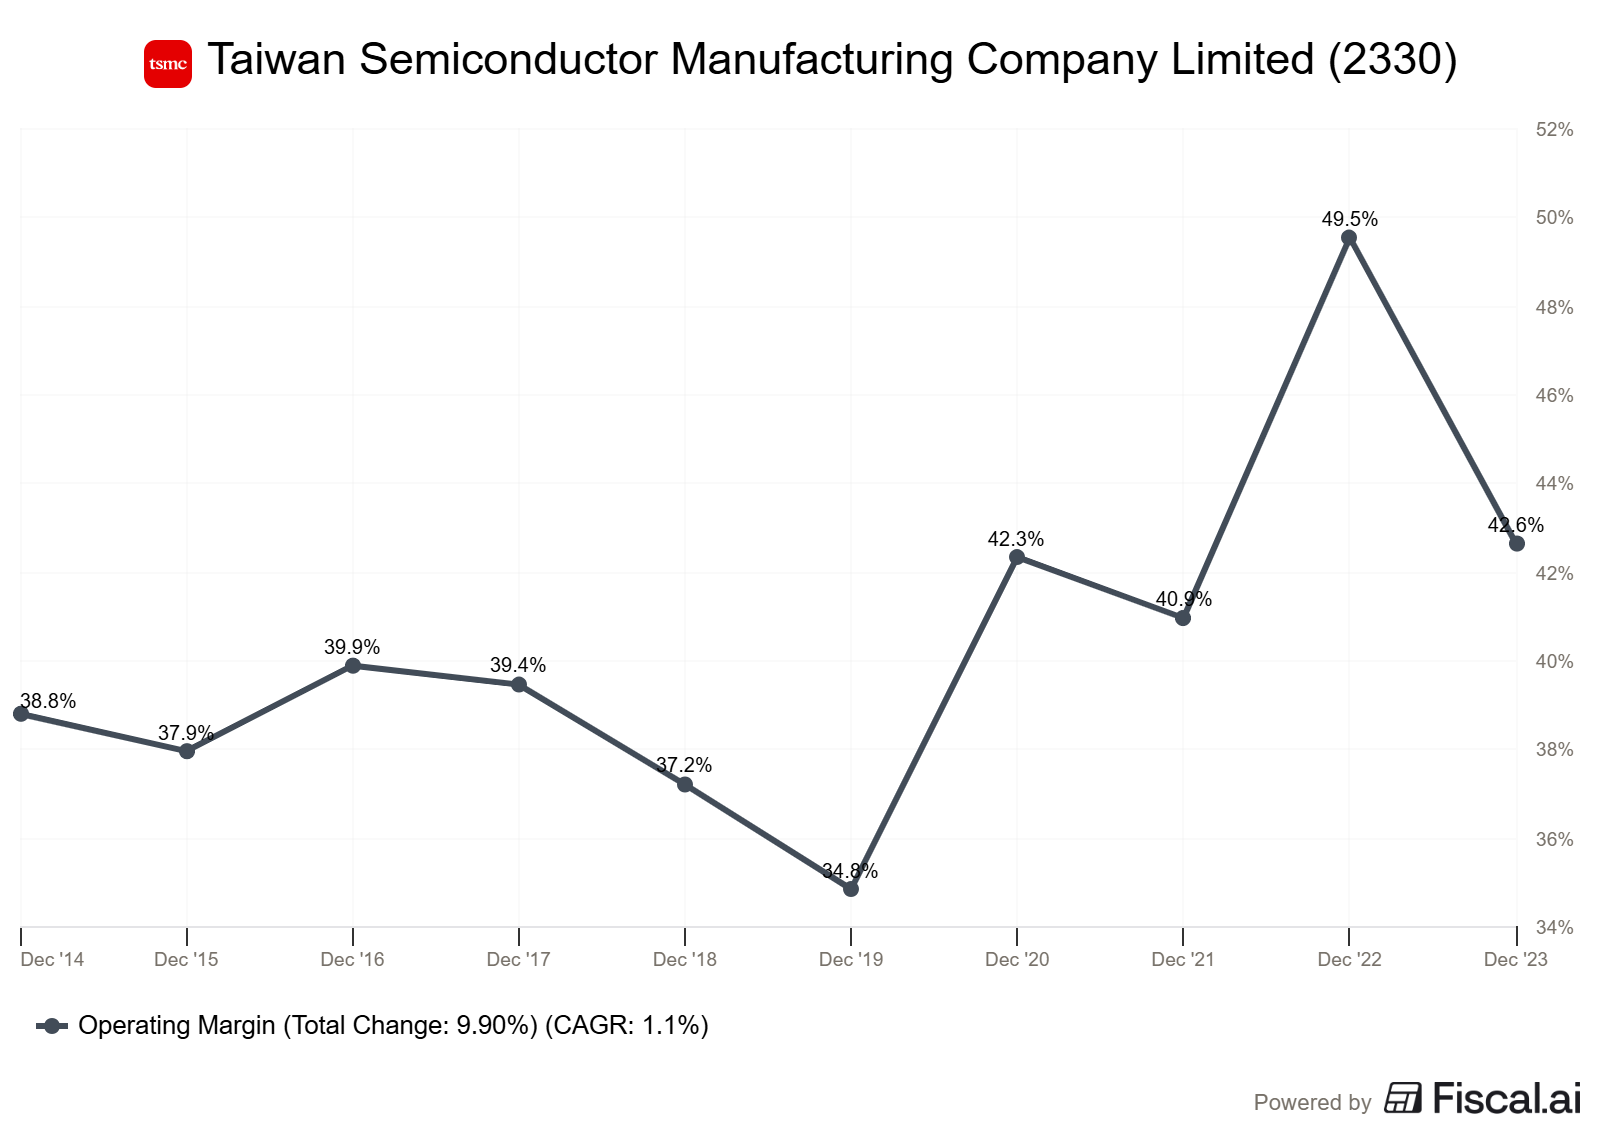
10-Year Average Operating Margin (2014-2023): (38.8 + 37.9 + 39.9 + 39.4 + 37.2 + 34.8 + 42.3 + 40.9 + 49.5 + 42.6) / 10 = 40.3%
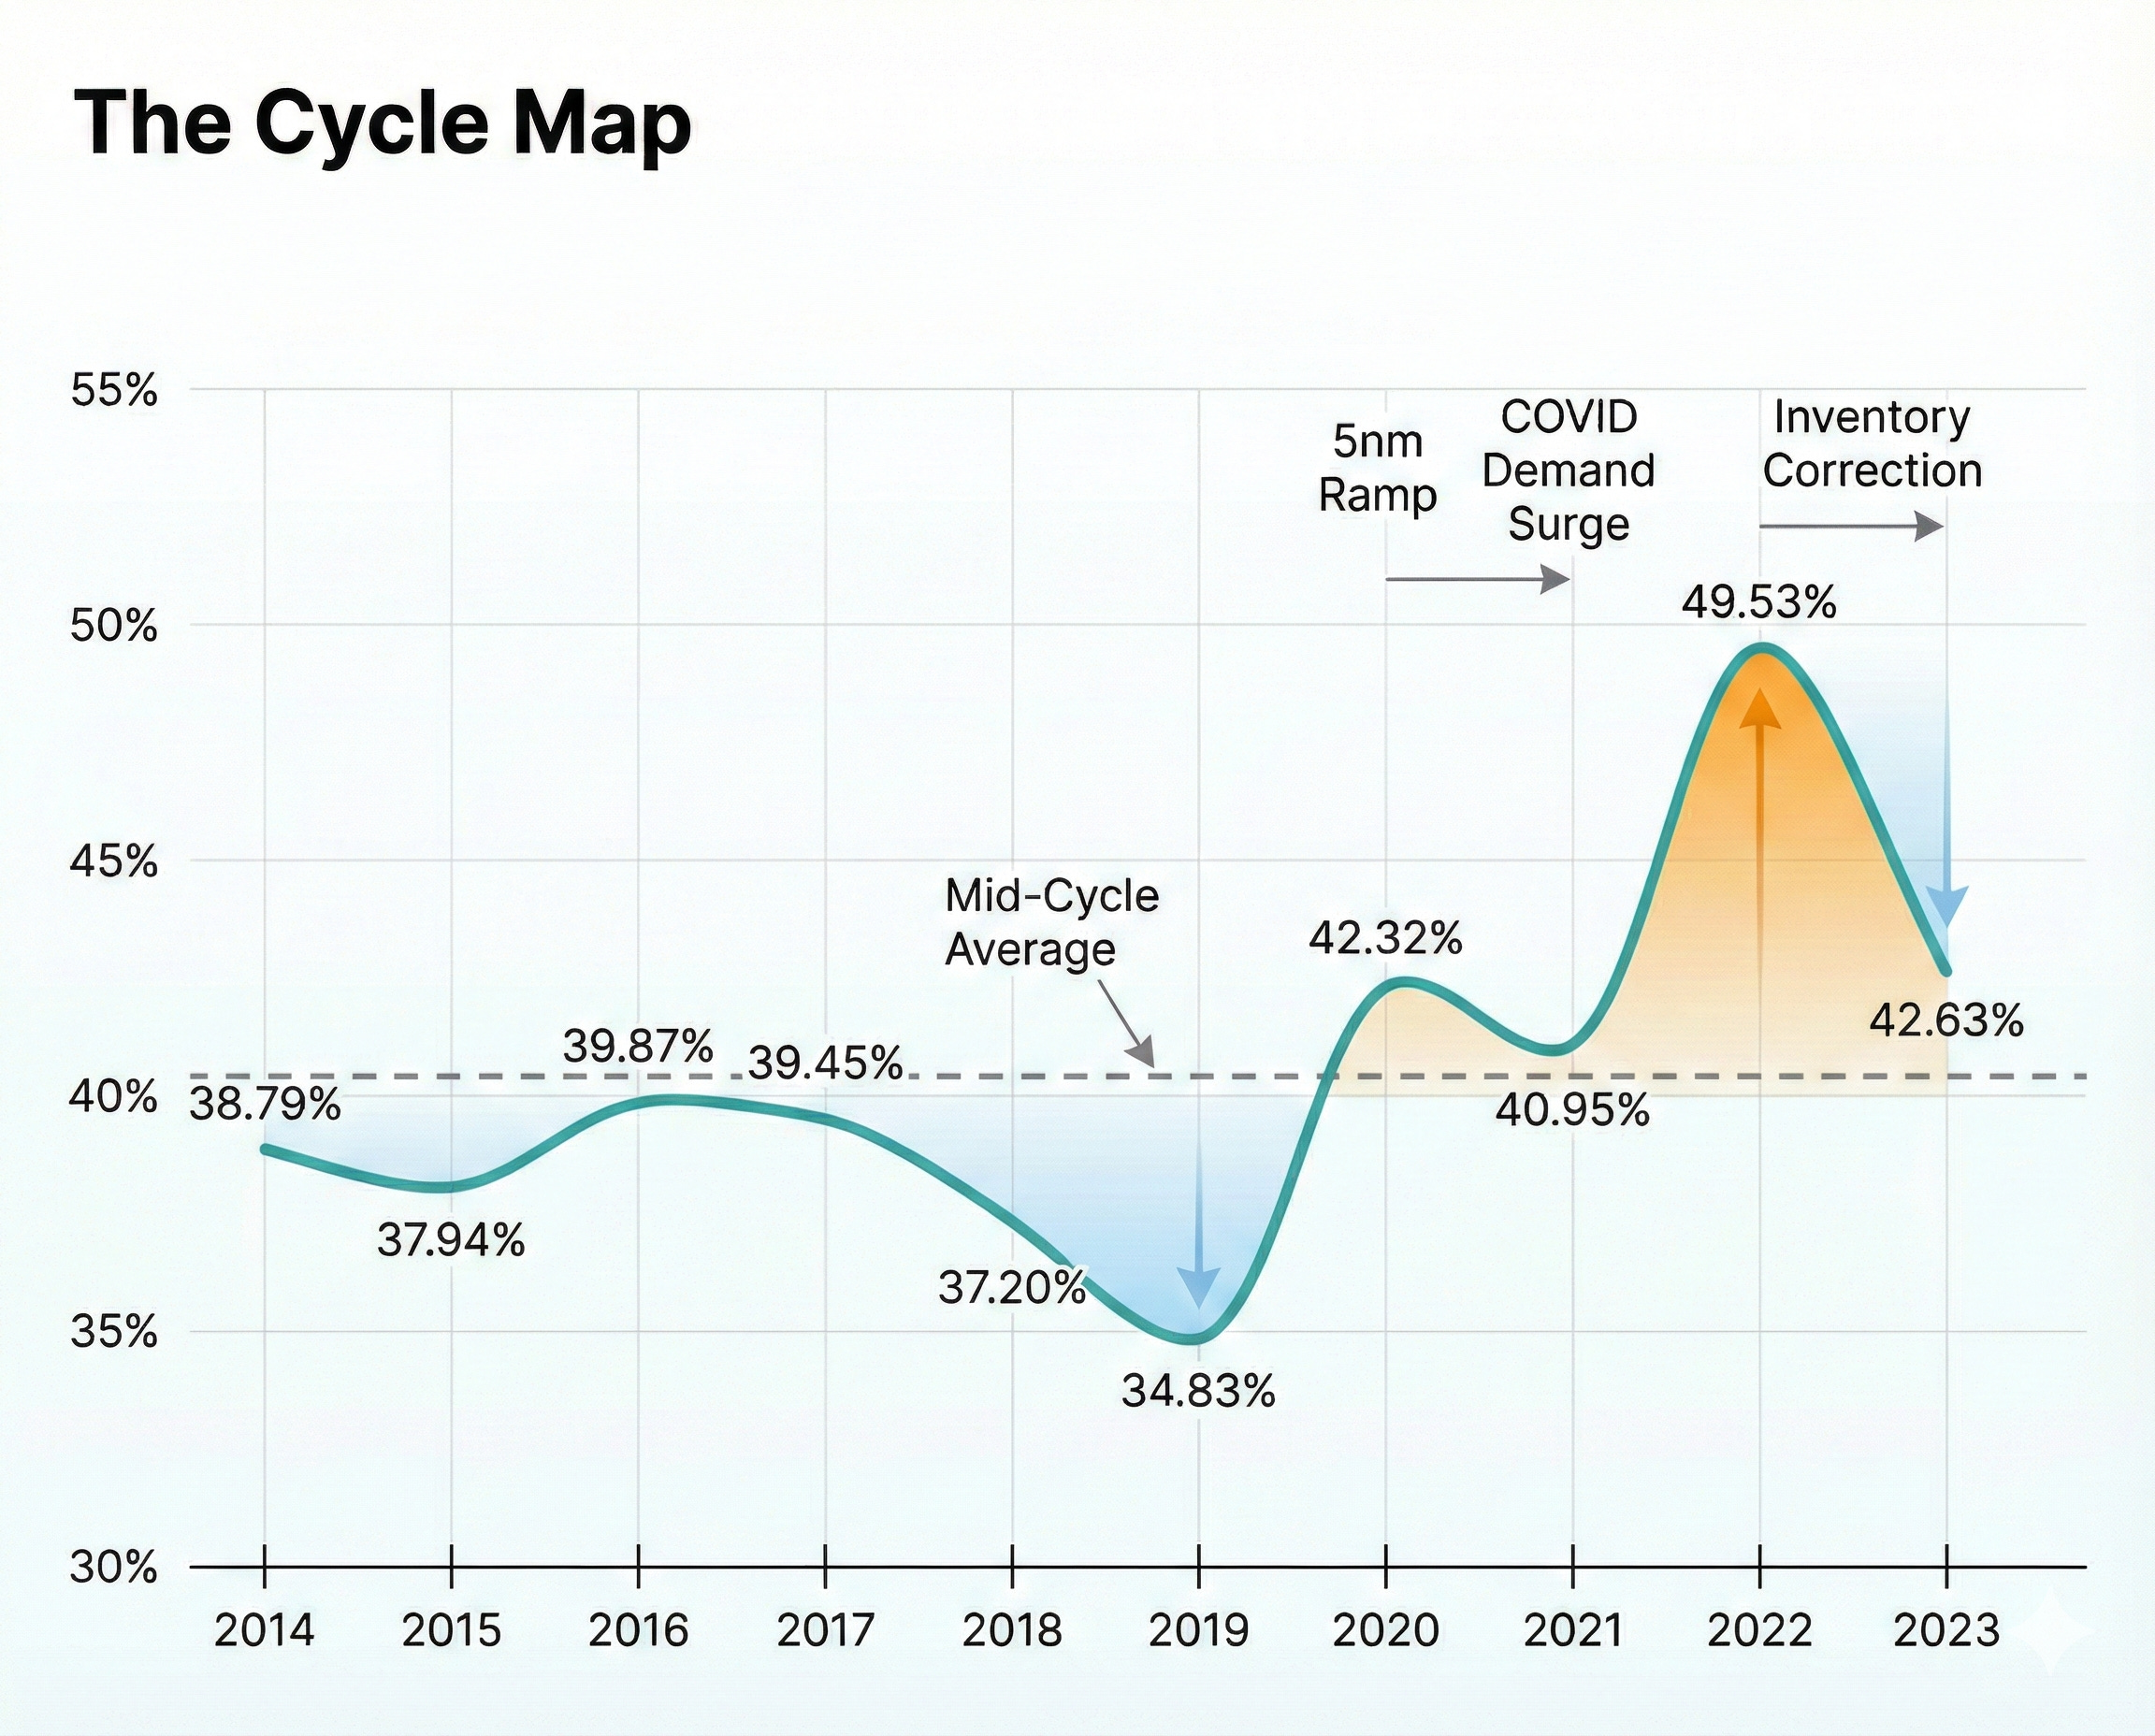
Now compare those mid-cycle figures to the extremes. TSMC’s operating margin ranged from a low of 34.8% in 2019 to a high of 49.5% in 2022. That’s a 14.7 percentage point swing, which translates to billions of dollars in operating income difference on the same revenue base. An investor anchoring to either extreme would build a fundamentally flawed valuation.
The 40.3% mid-cycle operating margin sits almost exactly between the peak and trough, giving you a durable baseline that reflects what TSMC actually earns through a full cycle.
What the Cycle Pattern Reveals
Look at the table again, and you’ll notice something important: TSMC’s margins aren’t random. They follow a recognizable rhythm. During 2014-2019, margins oscillated between roughly 35% and 40% on the operating line. Then starting in 2020, the entire band shifted higher, with operating margins ranging from 41% to 50%.
This tells you something that a simple average can’t: TSMC’s mid-cycle profitability is likely improving over time. The company’s mix shift toward advanced nodes (7nm and below), its pricing discipline, and its growing competitive moat have structurally lifted the margin floor. We’ll address how to handle this kind of secular shift shortly, because it matters enormously for valuation.
Knowing the concepts is one thing. Being able to sit down with a real dividend stock and actually analyze it is another. Paid membership gives you the tools to bridge that gap:
📊 1. Stock Analysis Infographic Library: 180+ visual references covering financial statements, valuation multiples, and dividend metrics, your cheat sheet for analyzing any company
🤖 2. AI Prompt Library: 10 purpose-built prompts that turn AI into a research partner, stress-test your thesis, dig into financials faster, and catch risks you’d otherwise miss
🔧 3. Investing Tools Suite: 4 analytical tools that take the friction out of the numbers so you can focus on understanding the business, not wrestling with spreadsheets
🎓 4. Skill Workshop: Practical working sessions walking through real company analysis start to finish, not theory, not lectures, actual practice
📈 5. Dividend Analysis Course (Coming Soon): A complete step-by-step course on analyzing dividend stocks using Buffett-inspired fundamental analysis
🔓 6. Everything Added Going Forward: Every new resource, tool, and prompts added automatically, no extra charge, ever
Applying Mid-Cycle Margins to a Valuation
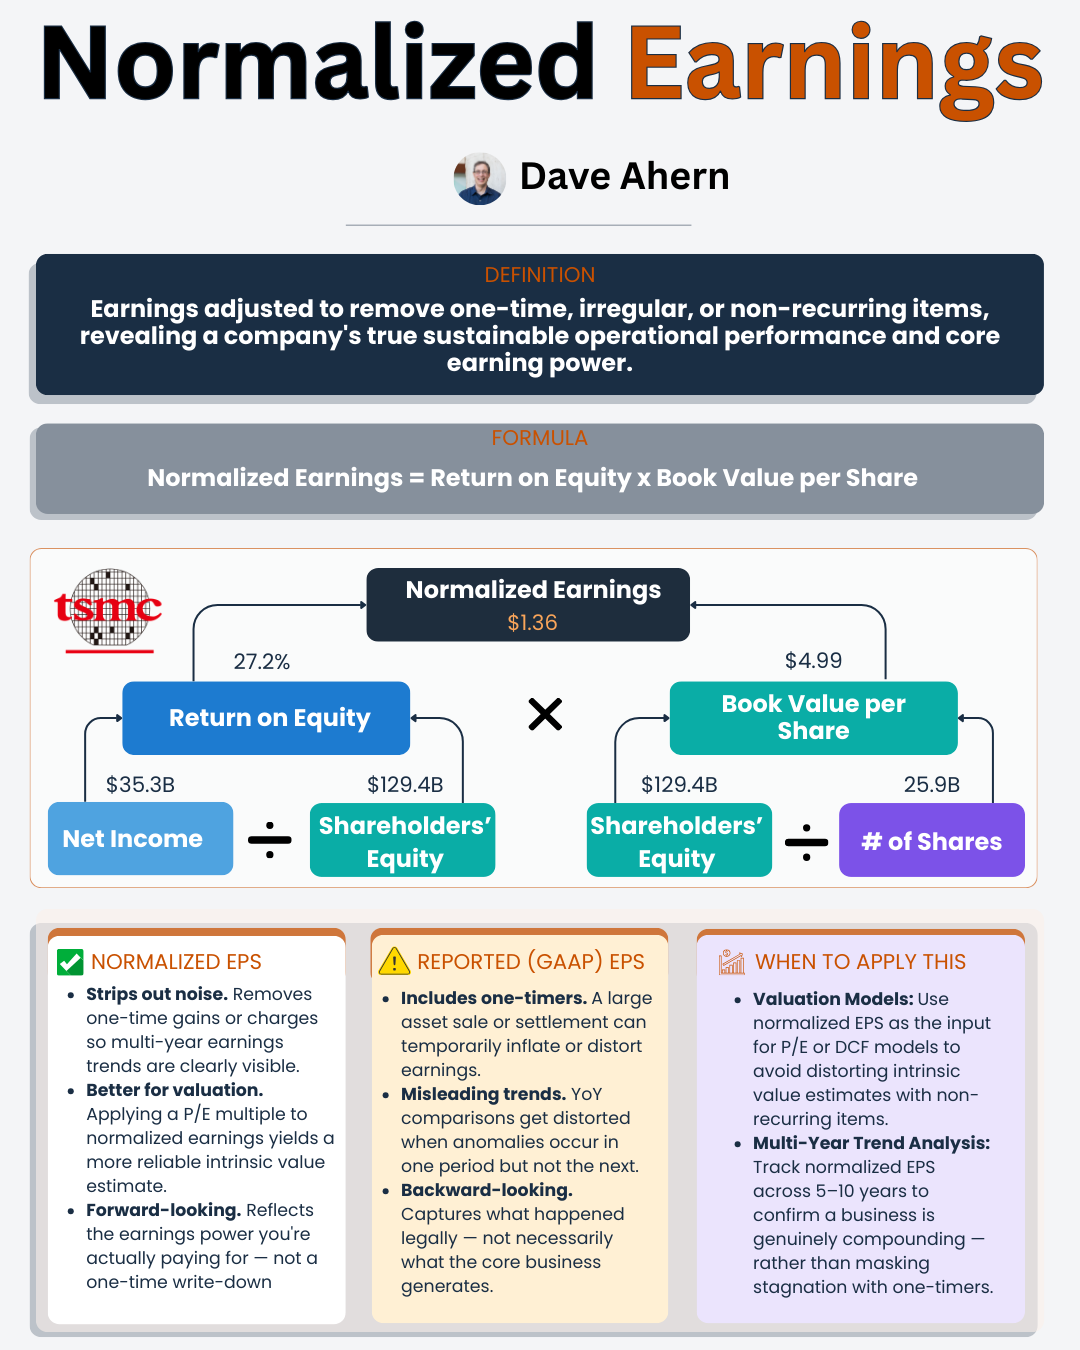
The whole point of calculating mid-cycle margins is to produce a normalized earnings figure you can plug into a valuation. Here’s how that works in practice with TSMC.
Step 1: Choose Your Revenue Baseline
You need a revenue figure to pair with your mid-cycle margin. You have three options, each with tradeoffs.
Option A: Trailing twelve-month revenue. Using TSMC’s 2024 annual revenue of approximately NT$2,894 billion (per TSMC’s 2024 Annual Report) gives you a current snapshot, but if the company is at a peak or trough in its revenue cycle, this can distort results.
Option B: Mid-cycle revenue. Average the last 10 years of revenue to get a smoothed figure. This is the most conservative approach, but it can significantly understate the earnings power of a growing company like TSMC.
Option C: Forward consensus revenue. Use analyst estimates for the next twelve months. This is pragmatic but introduces forecast risk.
For a company like TSMC with strong secular growth (revenue roughly doubled from 2014 to 2023), Option A or C is more realistic than Option B. The key is pairing your revenue choice with the mid-cycle margin, not with the margin from the same period.
Step 2: Apply the Mid-Cycle Operating Margin
Using TSMC’s 2024 revenue of NT$2,894 billion and our 10-year mid-cycle operating margin of 40.3%:
Normalized Operating Income = NT$2,894B x 40.3% = ~NT$1,166B
Compare this to TSMC’s actual 2024 operating income of NT$1,323 billion (per the 2024 Annual Report). The normalized figure is roughly 12% lower, suggesting that 2024’s profitability was above mid-cycle levels. This is a useful sanity check: it tells you that if you’re valuing TSMC based on 2024 earnings alone, you’re building in some cyclical optimism.
Step 3: Convert to Normalized Earnings
Apply a typical tax rate and you arrive at normalized net income. TSMC’s effective tax rate has varied, but using a mid-cycle approximation of roughly 14% based on recent years:
Normalized Net Income ≈ NT$1,166B x (1 - 0.14) = ~NT$1,003B
TSMC’s actual 2024 net income was NT$1,158 billion. Again, actual earnings ran above the normalized estimate, confirming that 2024 was an above-mid-cycle year for profitability.
The Adjustment for Secular Improvement
Here’s where judgment enters the picture. TSMC’s margins have demonstrably shifted upward over the past decade. The 2014-2019 average operating margin was about 38.0%. The 2020-2023 average was roughly 43.8%. If you believe (as many analysts do) that TSMC’s competitive position, pricing power, and technology leadership have permanently improved, you might weigh the more recent half of the cycle more heavily.
One practical approach is to calculate a weighted mid-cycle margin, giving 60-70% weight to the most recent 5 years and 30-40% to the earlier period.
Weighted Mid-Cycle Operating Margin = (38.0% x 0.35) + (43.8% x 0.65) = 13.3% + 28.5% = ~41.8%
This 41.8% figure is higher than the simple average of 40.3% but lower than the recent peak of 49.5%. It reflects an honest assessment that TSMC’s earnings power has genuinely improved without assuming peak margins are permanent.
Texas Instruments: A Different Kind of Cycle
To appreciate how mid-cycle analysis works across different business models, let’s compare TSMC to Texas Instruments (TXN). Both are semiconductor companies, but they occupy very different positions in the industry.
TSMC is a pure-play foundry. It manufactures chips designed by other companies (Apple, Nvidia, AMD), and its margins fluctuate with utilization rates and technology node transitions. Texas Instruments designs and manufactures its own analog and embedded processing chips, selling into automotive, industrial, and personal electronics markets.
Here’s TXN’s 10-year operating margin history, sourced from annual reports (10-K filings with the SEC):
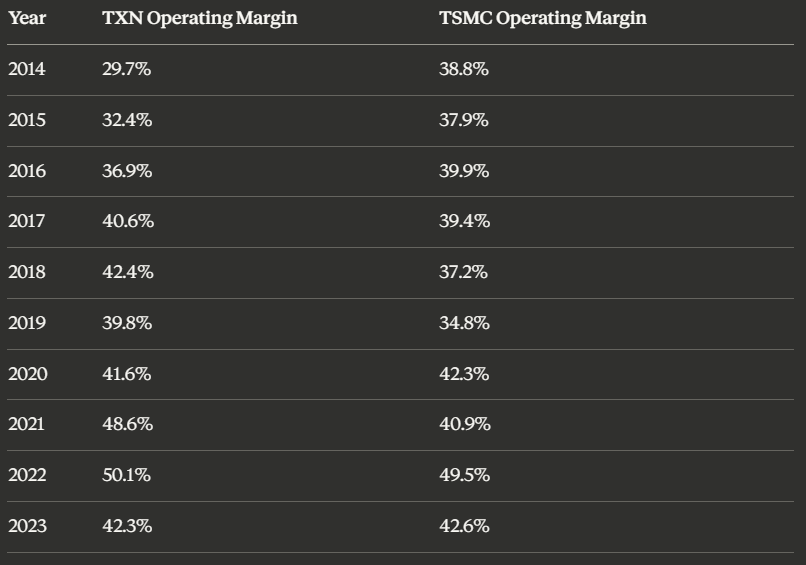
Source: TXN operating margins from TXN 10-K annual reports filed with the SEC; TSMC margins from TSMC 20-F annual reports.
TXN 10-Year Average Operating Margin (2014-2023): 40.4%
TSMC 10-Year Average Operating Margin (2014-2023): 40.3%
The mid-cycle averages are nearly identical. But the paths to get there couldn’t be more different. This is exactly why mid-cycle analysis requires context, not just calculation.
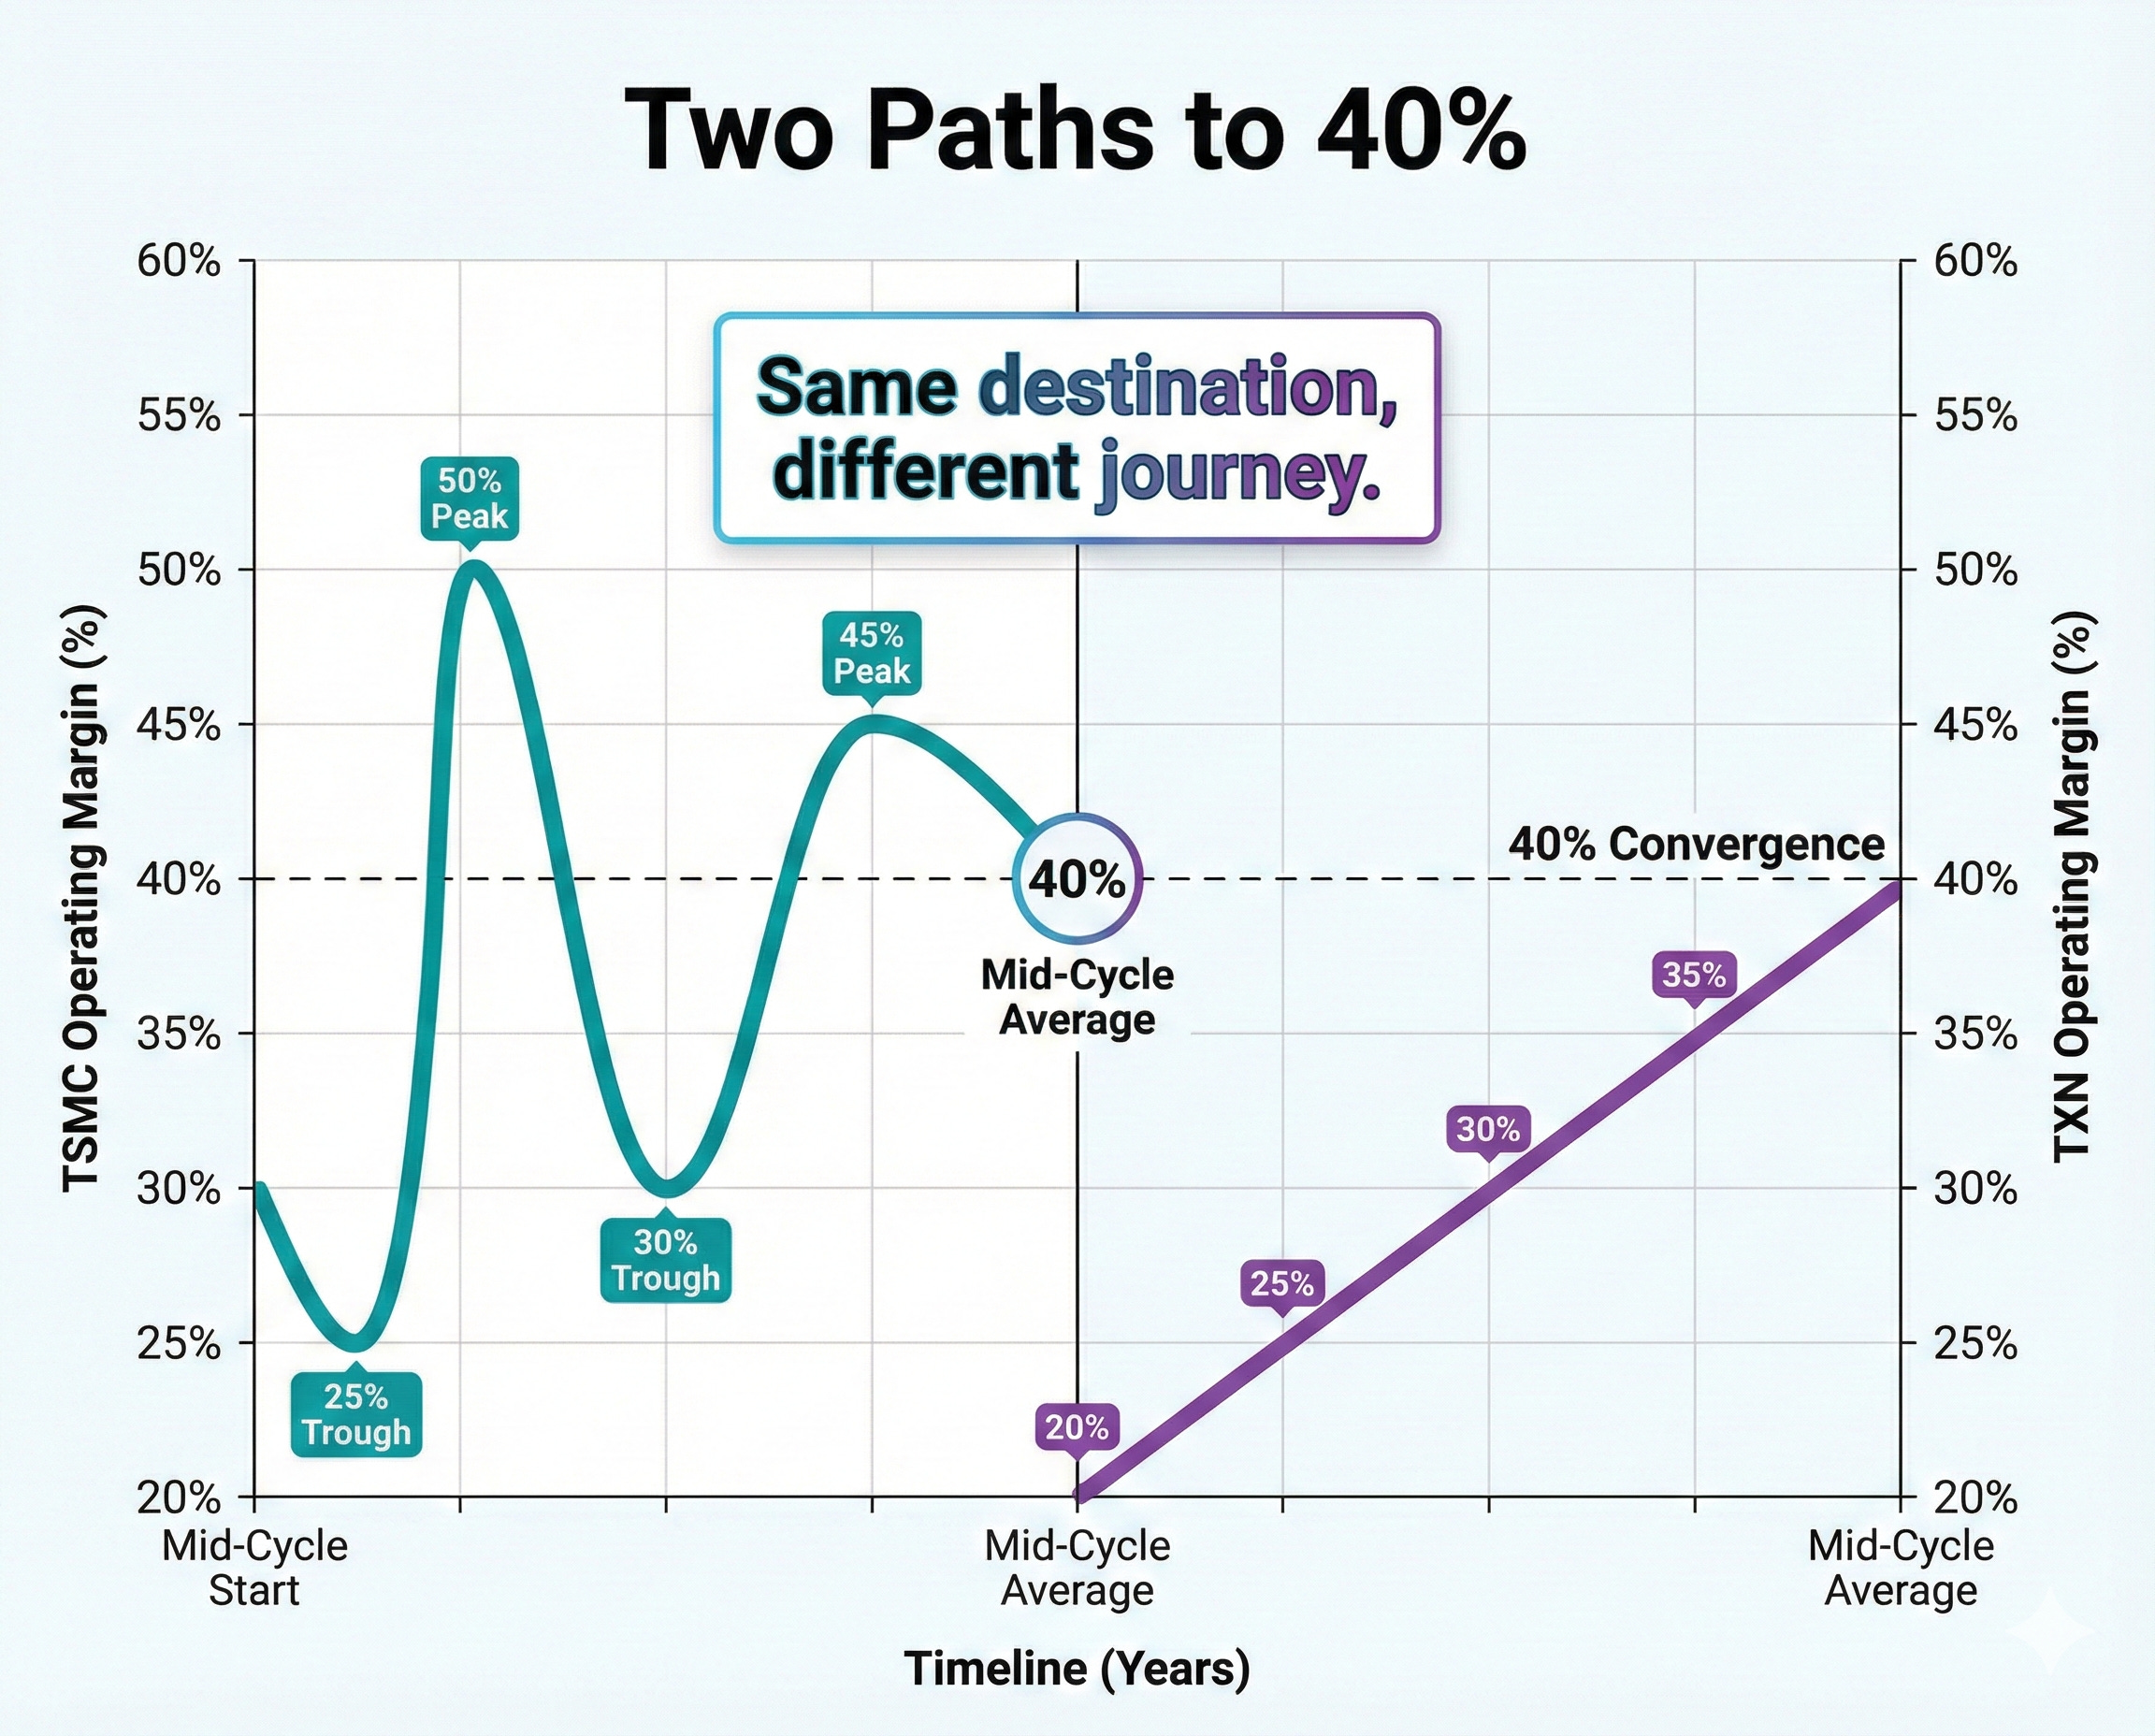
TXN’s Secular Margin Expansion
Texas Instruments went from a 29.7% operating margin in 2014 to a peak of 50.1% in 2022. That’s not cyclical oscillation. That’s a structural transformation driven by three factors: TI’s deliberate exit from lower-margin product lines (such as wireless chips), its shift toward analog and embedded processing, where it has pricing power, and its aggressive cost optimization in manufacturing.
If you simply averaged TXN’s last 10 years, you’d get 40.4%, which actually understates TXN’s current earning power. The 2014-2016 period reflects a company still in the midst of a business model transformation. Using those years in your average penalizes TXN for a version of itself that no longer exists.
How to Handle Secular Trends in Mid-Cycle Analysis
This is one of the most important judgment calls in fundamental analysis. When you see a strong directional trend in margins, you need to separate three possible explanations:
1. Cyclical Peak Masquerading as Structural Improvement. This is the trap. Every cyclical peak feels permanent. The company’s management will explain all the “structural” reasons margins expanded. Sometimes they’re right. Often, they’re rationalizing a good cycle.
2. Genuine Business Model Improvement. TXN’s case is convincing because the margin expansion occurred over many years, across multiple industry cycles, and was driven by identifiable strategic decisions (product mix shift, manufacturing efficiency gains). The margin floor continued to rise even in down years.
3. Industry-Wide Tailwind. Sometimes an entire industry experiences margin expansion due to consolidation, regulatory changes, or structural shifts in demand. This benefits all players but may not be permanent.
The test I use: Did the margin floor rise from one cycle through to the next? TSMC’s operating margin trough went from 34.8% in 2019 to 42.6% in 2023 (the most recent down year). TXN’s trough went from 29.7% in 2014 to 39.8% in 2019 to 42.3% in 2023. In both cases, the answer is yes, indicating genuine structural improvement rather than cyclical noise.
The Framework: Mid-Cycle Margin Analysis in 5 Steps
Here’s the process you can apply to any cyclical company in your portfolio.
Step 1: Gather 7-10 Years of Annual Margin Data. Pull gross margin and operating margin from SEC filings (10-K for U.S. companies, 20-F for foreign filers). You want enough years to capture at least one full cycle. For most industries, 7-10 years works. For very long-cycle industries (energy, mining), you may need 12-15 years.
Step 2: Identify the Cycle Peaks and Troughs. Mark the years where margins hit local highs and lows. Look for the pattern. In semiconductors, you’ll typically see 2-3 year expansions followed by 1-2 year contractions. Understanding the rhythm helps you assess where the company sits today relative to its cycle.
Step 3: Calculate the Simple Average. Sum the operating margins across all years, then divide by the number of years. This is your baseline mid-cycle margin. It’s the starting point, not the final answer.
Step 4: Test for Secular Trends. Compare the first half of your data window to the second half. If the averages differ by more than 3-5 percentage points, investigate why. Look at whether margin troughs are rising over time. If you identify a genuine structural improvement, consider using a weighted average that gives more weight to more recent data.
Step 5: Apply to Valuation. Pair your mid-cycle margin with an appropriate revenue figure to calculate normalized operating income. Then flow it through to normalized earnings. Use this as the “E” in your P/E analysis or as the earnings base in a DCF model. This gives you a valuation grounded in what the company earns over the cycle, not just at a single point.
Common Mistakes to Avoid
Mistake 1: Using too few years. A 3-year average that captures only an up-cycle will overstate mid-cycle earnings. Always ensure your window includes at least one clear trough.
Mistake 2: Ignoring structural breaks. If a company made a major acquisition, divested a segment, or fundamentally changed its business model, the older margin data may not be comparable. In such cases, start your analysis from the year after the structural change.
Mistake 3: Applying mid-cycle margins to peak revenue. If you use a mid-cycle margin on an above-trend revenue figure, you’ll still overstate normalized earnings. Be consistent: either normalize both revenue and margins, or use current revenue with an explicit acknowledgment that you’re measuring today’s scale at mid-cycle profitability.
Mistake 4: Treating the average as gospel. Mid-cycle margins are an estimate, not a fact. The actual mid-cycle could be slightly higher or lower, depending on how you weight the data. Use a range (say, 39-42% for TSMC) rather than a single point to reflect this uncertainty in your valuation.
Closing Takeaway
When you’re analyzing any cyclical business, resist the temptation to anchor on the most recent year’s margins. Instead, calculate the mid-cycle average across a full cycle, check for secular trends, and use that normalized figure as the foundation for your valuation. It won’t give you precision, but it will give you something far more valuable: a realistic baseline that prevents you from overpaying at the top or panicking at the bottom.
Knowing the concepts is one thing. Being able to sit down with a real dividend stock and actually analyze it is another. Paid membership gives you the tools to bridge that gap:
📊 1. Stock Analysis Infographic Library: 180+ visual references covering financial statements, valuation multiples, and dividend metrics, your cheat sheet for analyzing any company
🤖 2. AI Prompt Library: 10 purpose-built prompts that turn AI into a research partner, stress-test your thesis, dig into financials faster, and catch risks you’d otherwise miss
🔧 3. Investing Tools Suite: 4 analytical tools that take the friction out of the numbers so you can focus on understanding the business, not wrestling with spreadsheets
🎓 4. Skill Workshop: Practical working sessions walking through real company analysis start to finish, not theory, not lectures, actual practice
📈 5. Dividend Analysis Course (Coming Soon): A complete step-by-step course on analyzing dividend stocks using Buffett-inspired fundamental analysis
🔓 6. Everything Added Going Forward: Every new resource, tool, and prompts added automatically, no extra charge, ever
I think a good aproach is starting from last marging tend it to median margins, as margings improved the median willl increas. What do you think? Another aproach I do IS a Montecarlo simulation.