
Measuring Stickiness: Datadog’s Cohorts, RPO, and FCF Conversion Explained

Software moats rarely show up in GAAP net income. They show up in cohorts, contracts, and cash.
Today we use Datadog to map accounting to economics: how usage-based pricing combines with data gravity and multi-product adoption to create durable, per-share value.
If you’ve ever wondered how to convert SaaS reports into an “owner earnings” lens and test stickiness with real evidence, this is your guide.
TL;DR
Quality in SaaS = durable unit economics plus reinvestment discipline. Focus on ROIC vs WACC using an adjusted (capitalized R&D) approach and per-share value creation.
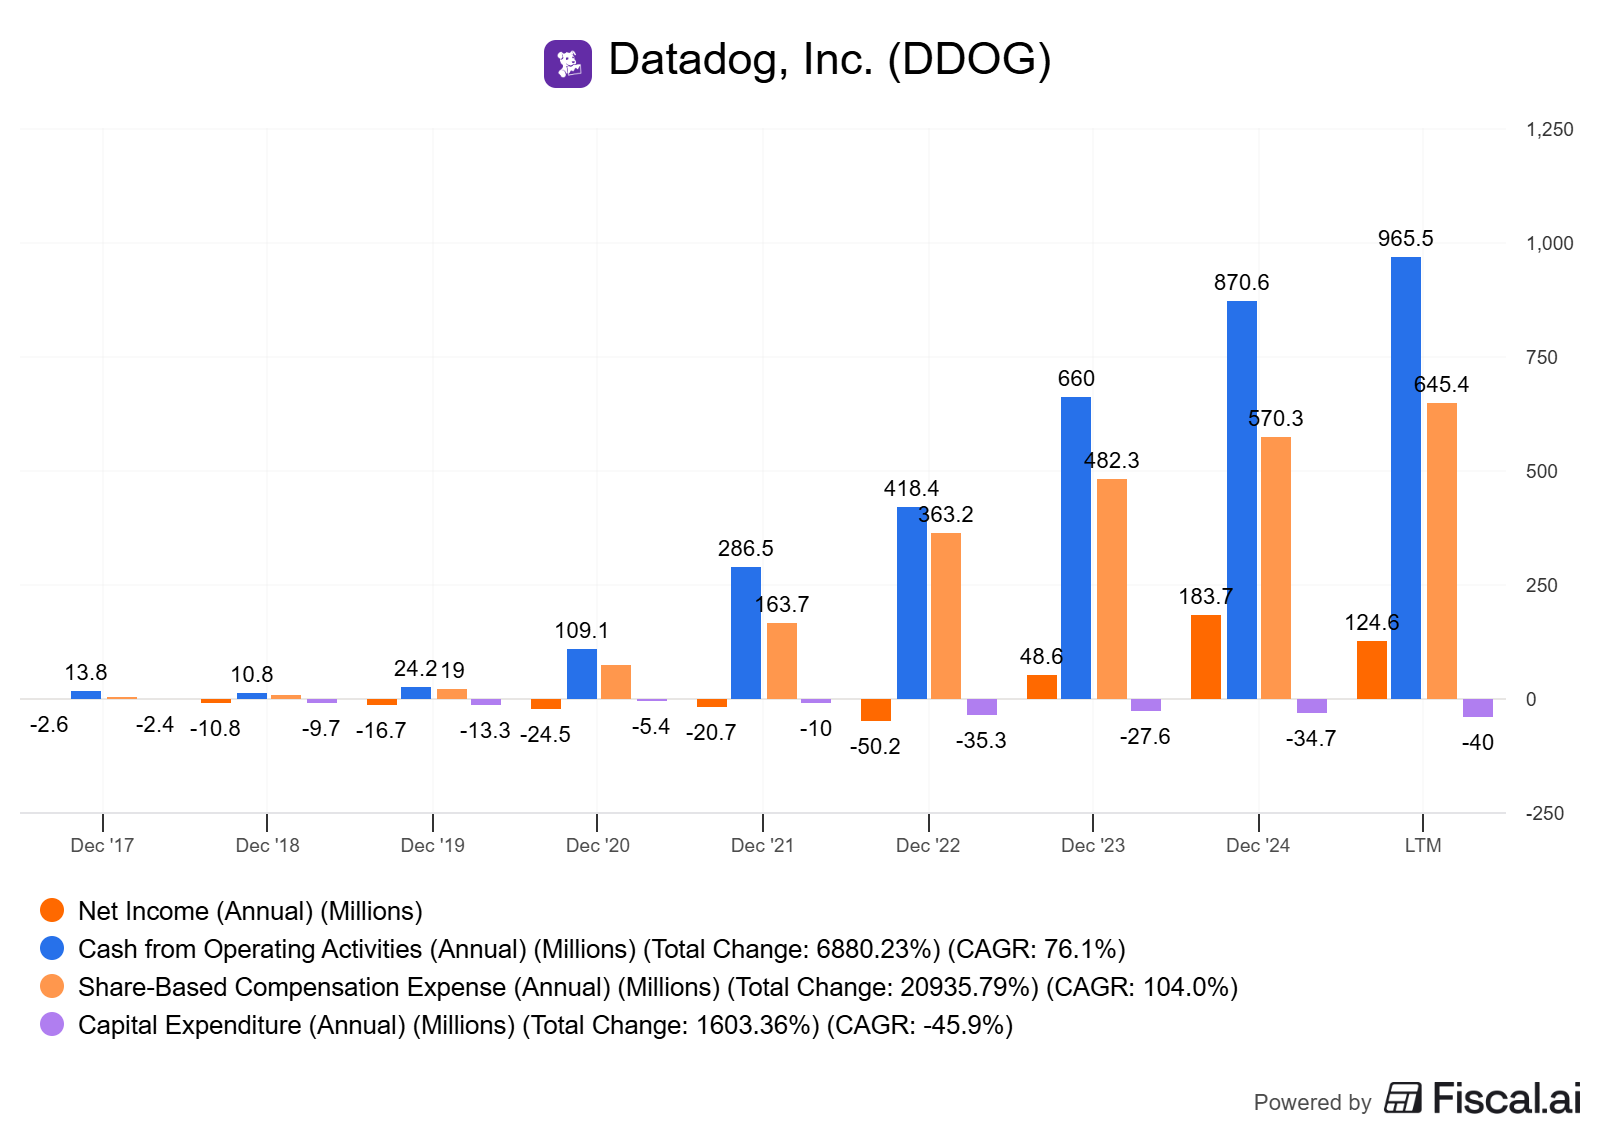
For Datadog, stickiness shows up in multi-product adoption, large-customer expansion, high gross revenue retention, and strong FCF conversion (31–33% in recent quarters) [as of 2024–2025] (Datadog PR via Nasdaq, Q1’24 transcript).
Usage-based pricing can add volatility, but it also compounds as customers add data sources and modules. Evidence: >850 integrations and rising multi-product adoption [as of Q4’24] (Q4’24 call).
Reconcile GAAP → owner earnings by adjusting for stock-based compensation (SBC), deferred revenue dynamics, capitalized development (if any), working capital seasonality, and maintenance capex.
Decision rules: Prefer sustained ROIC – WACC > 5%, gross margin > 75%, FCF margin > 20% mid-cycle, gross revenue retention in mid/high-90s, and credible evidence of cohort expansion.
Why it matters
Investors often misread high-growth software. GAAP net income understates owner earnings when growth investments are recorded through the income statement (R&D, S&M) and result in front-loaded cash (deferred revenue inflows).
The result: cash can appear stronger than earnings during growth, and moats emerge in cohort behaviors rather than GAAP line items.
Base rates help.
In high-quality SaaS, gross margins exceeding 75%, FCF margins exceeding 20% at mid-cycle, and gross revenue retention rates in the mid-to-high 90s are common among category leaders.
But the edge comes from reinvestment returns: is incremental capital deployed into modules, sales, and R&D compounding per-share value at rates above the cost of capital?
Core concepts (quality lens)
ROIC vs WACC and value creation
ROIC (return on invested capital) measures how effectively a firm turns capital into after-tax operating profit. For software, the trick is defining “invested capital.” Many growth investments are expensed, which can depress NOPAT and understate the capital base if they are not capitalized.
Practical approach for SaaS:
Capitalize R&D over a 2–3 year useful life.
Treat a portion of S&M as growth capex (customer acquisition) with an 18–24 month amortization, especially when net new ARR is large and payback is short.
Adjust NOPAT for these amortizations.
Compare adjusted ROIC to WACC. Aim for ROIC – WACC > 5% sustained, ideally more in the out-years. A positive spread that widens with scale signals durable advantages.
Reinvestment runway and capital intensity
Reinvestment runway = the set of high-return opportunities a company can deploy into (new products, geos, segments). A long runway with low incremental capital intensity supports compounding.
For observability, runway is driven by:
Data growth (more telemetry).
Workload complexity (containers, microservices, AI/LLM stacks).
Platform breadth (security, software delivery, service management).
Capital intensity: Physical capex is modest for SaaS, but data infrastructure and third-party cloud costs matter and show up in gross margin and COGS.
Unit economics and per-share metrics
Key unit signals: gross margin stability, sales efficiency (LTV/CAC, payback period), cohort expansion (net retention), and FCF conversion.
Per-share framing: track diluted share count, SBC as a percent of revenue, buybacks (if any), and the economic cost of SBC (future repurchases or dilution). The goal is growth in FCF per share, not just aggregate FCF.
Moat durability: evidence, not claims
Look for:
Integration breadth (how many data sources?).
Multi-product adoption (% of customers using 4+, 6+, 8+ products).
Large customer counts (> $100k and > $1m ARR).
Retention (gross and net), low churn, and usage expansion.
Migration costs and switching friction (agents, dashboards, workflows).
Datadog evidence includes >850 integrations; rising multi-product adoption; and large customer growth [as of Q4’24] (Q4’24 call).
Mode focus: Accounting nuances and economic reality
Deferred revenue/RPO: upfront billings boost operating cash flow; revenue recognition lags. Seasonality (Q1 billings spike) affects FCF timing.
Usage-based pricing: consumption swings can distort quarter-to-quarter growth; cohort analysis smooths this.
SBC: true economic cost shows up via dilution or repurchases; adjust “owner earnings” for an SBC cash-equivalent.
Capitalized software: if present, separate maintenance vs growth; treat maintenance as sustaining capex in owner earnings.
Worked example: Datadog
Context and disclosures
FY2024 revenue: $2.68B, +26% Y/Y; Q4’24 revenue: $738M, +25% Y/Y. FY2024 free cash flow (FCF): $775M; Q4’24 FCF margin: 33% (Datadog PR via Nasdaq, Feb 13, 2025).
Customers: ~30,000 total; 3,610 with $100k+ ARR; 462 with $1M+ ARR [as of Dec 31, 2024] (Nasdaq PR, Q4’24 call).
Product breadth: >850 integrations; expansion across observability, security, and service management (Q4’24 call).
Gross margin: 83.3% in Q1’24 (guidepost) (Q1’24 call, May 7, 2024).
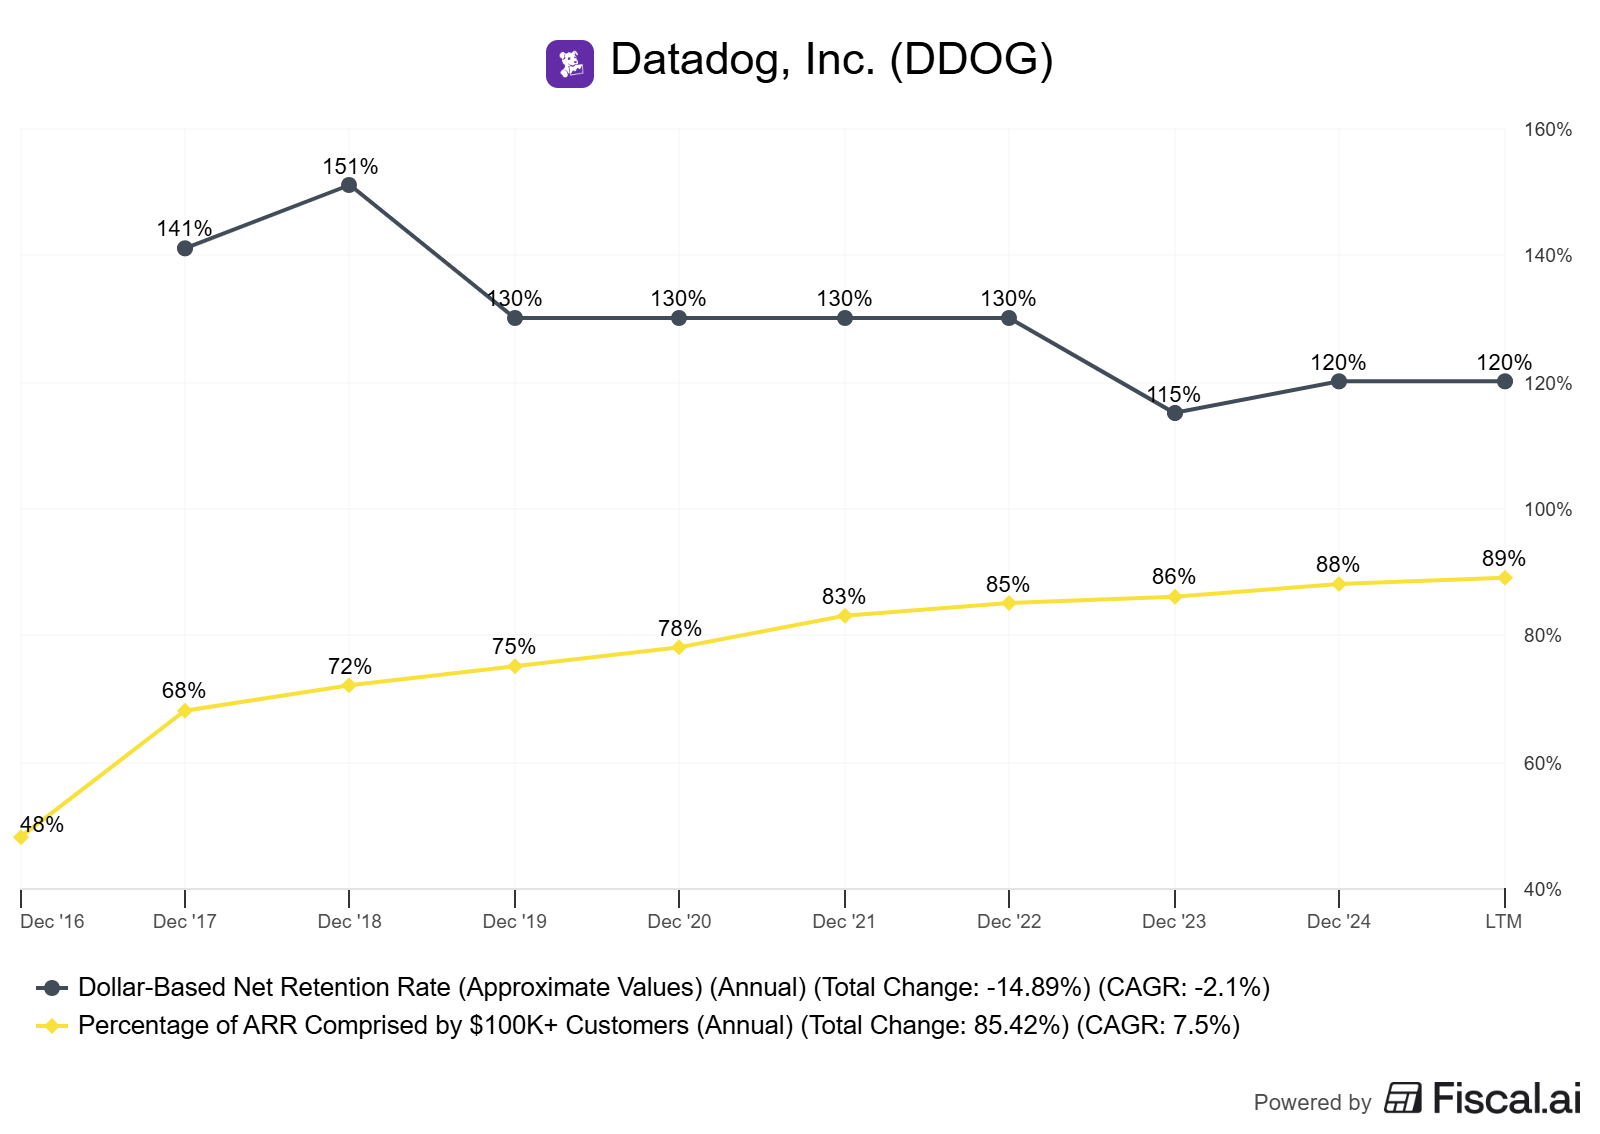
Retention: gross revenue retention mid- to high-90s (low churn) [as of Q4’24] (Q4’24 call).
Economic signals and what they imply
Data gravity: the more systems instrumented, the more telemetry flows in. High switching costs emerge from agents, dashboards, alerting workflows, and incident runbooks.
Pricing and monetization: usage-based model aligns with data growth; Flex Logs and pipelines enable cost-optimized ingest while keeping customers within the platform (land-and-expand dynamic).
Contract stickiness: large-customer counts rising; multi-product adoption increasing (e.g., 50% using 4+ products; 26% using 6+; 12% using 8+ [as of Q4’24]) (Q4’24 call). Combined with gross revenue retention in the mid/high-90s, this suggests durable cash flows.
Accounting reality: GAAP → owner earnings
Start with operating cash flow (OCF) and adjust:
Subtract maintenance capex (data infra/tools—relatively modest).
Normalize for deferred revenue seasonality (Q1 inflows).
Add back (or subtract) one-off working capital shocks.
Consider SBC as an economic outflow via assumed future buybacks to maintain dilution at a flat level.
For FY2024, FCF margin was ~29% ($775M on $2.68B revenue) with Q4 FCF margin ~33%—robust conversion for a growth-stage platform (Nasdaq PR).
Accounting nuances to watch
SBC and dilution: guidance implies ~366–369M weighted avg diluted shares in 2025; treat SBC as a cash-equivalent if the business targets steady share count over time (Nasdaq PR).
Convertible notes: Adds potential dilution if settled in shares; note 0% 2029 converts issued in Dec 2024 (Nasdaq PR).
Usage normalization: Management noted lower optimization intensity vs 2023 and steady expansion in 2024; still, expect intra-year consumption swings (Q1’24 and Q4’24 calls).
5–6 year trend markers (IPO 2019)
Margins: gross margin ~80–83% with improving operating leverage as scale increases.
FCF conversion: positive and strengthening, with seasonal peaks in Q1 tied to billings.
Per-share: diluted share count rising with SBC and converts; evaluate FCF/share growth rather than absolute FCF.
Caveats and alternative reads
Capitalizing S&M for ROIC increases judgment risk; disclose your assumptions and test sensitivity.
Net retention isn’t disclosed as a single number; rely on triangulation (gross retention, large-customer growth, multi-product adoption).
Elevated SBC can dilute per-share economics if not offset by buybacks or rising FCF/share.
How to do this yourself (step-by-step)
Data to gather (primary sources)
Annual/quarterly reports and press releases for: revenue, gross/operating margin, OCF/FCF, SBC, deferred revenue, RPO, customer counts by ARR tier, product adoption.
Datadog FY2024 PR (Feb 13, 2025) for headline numbers and share count guidance: Nasdaq PR.
Earnings call transcripts for cohort and product adoption data: Q4’24, Q1’24.
Investor Day decks for longer-term mix and strategy (Feb 2024): Investor Day deck.
Exact checks/calculations
FCF conversion: FCF margin = FCF / Revenue. Track seasonality (Q1 often high).
Per-share: FCF per diluted share; trend diluted shares; compute SBC as % revenue.
Working capital: DSO/DPO and CCC; reconcile OCF to changes in deferred revenue.
“Owner earnings”:
Start with OCF.
Subtract maintenance capex (estimate if not broken out).
Normalize for deferred revenue seasonality (use multi-year average).
Subtract SBC cash-equivalent (e.g., target repurchases to hold dilution flat).
Result = “owner FCF.”
Adjusted ROIC (heuristic):
Capitalize R&D (2–3 year life) and a portion of S&M (18–24 months) tied to new ARR.
NOPAT_adj = EBIT + amortization of capitalized R&D/S&M – new capitalization amounts, taxed.
Invested Capital_adj includes net working capital + capitalized software + capitalized R&D/S&M net of amortization.
Decision rules and thresholds
Prefer ROIC – WACC > 5% sustained; positive ROIIC (incremental ROIC) while scaling.
Gross margin > 75%; stable to rising with scale.
FCF margin > 20% mid-cycle; >25% in mature steady state.
Gross revenue retention mid/high-90s; growing large-customer counts; rising multi-product adoption.
Per-share: FCF/share growing faster than diluted shares.
Pitfalls and false positives
Treating all R&D as expense without capitalizing can understate true returns (but over-capitalizing inflates them). Disclose and stress test.
Confusing billings cycles with demand. Q1 billings-driven OCF spikes aren’t the same as structural cash generation.
Ignoring SBC. If share count rises steadily, per-share value creation may lag.
Overweighting “AI tailwinds” without evidence in cohort expansion or product adoption metrics.
Cherry-picking “best quarter” metrics. Use multi-year medians and mid-cycle margins.
Checklist / one-pager
Durability
Gross revenue retention ≥ mid-90s.
Large customers ($100k+ and $1M+) growing faster than total.
Multi-product adoption rising; deep integration count high.
Economics
Gross margin ≥ 75%; FCF margin ≥ 20% mid-cycle.
Adjusted ROIC > WACC by ≥ 5%; ROIIC positive.
FCF/share up and to the right; SBC ≤ low-teens % of revenue over time.
Accounting reconciliation
GAAP → owner earnings bridge done and documented.
Deferred revenue impacts and seasonality normalized.
SBC cash-equivalent reflected; convert dilution considered.
Reinvestment
Clear runway (modules, security, service mgmt).
Capital intensity modest; unit economics strong (payback ≤ 24 months).
Mini-FAQ
Why is Datadog’s FCF higher than net income?
Because growth investments (R&D/S&M) run through the P&L while contracts often bill upfront, boosting cash via deferred revenue.Does usage-based pricing increase risk?
It adds volatility, but with strong cohort expansion and low churn, it can amplify upside when data growth resumes.How do I adjust for SBC?
Assume the firm buys back stock to offset dilution and treat SBC as a cash-equivalent outflow in “owner earnings.”What proves stickiness?
Gross revenue retention mid/high-90s, rising large-customer counts, increasing multi-product penetration, and breadth of integrations.Is ROIC meaningful for SaaS?
Yes, but only if you adjust for capitalized growth spending (R&D/S&M). Unadjusted ROIC often understates true economic returns.
Glossary
Gross revenue retention: Revenue kept from existing customers before expansion; a low churn proxy.
RPO (remaining performance obligations): Contracted backlog not yet recognized as revenue.
FCF (free cash flow): Operating cash flow minus capex; a proxy for cash available to owners.
SBC (stock-based compensation): Non-cash expense that dilutes shareholders unless offset by buybacks.
Capitalized R&D/S&M: Treating parts of growth spend as long-lived assets for ROIC analysis.
ROIIC: Incremental return on invested capital; return on the next dollar invested.
Usage-based pricing: Customers pay based on consumption (e.g., data ingest, hosts, tests).
Further reading
Datadog 2024 Investor Day deck (platform strategy and long-term mix) — Feb 2024: slides
“Customer-based Corporate Valuation” (Dan McCarthy, Peter Fader) — foundations for cohort/economic readings.
“Measuring and Managing the Value of Companies” (Koller et al., McKinsey) — ROIC and value creation frameworks.
References
Datadog Announces Fourth Quarter and Fiscal Year 2024 Financial Results — Nasdaq copy of press release — as of Feb 13, 2025: Nasdaq
Datadog Q4 2024 Earnings Call Transcript — as of Feb 13, 2025: The Motley Fool
Datadog Q1 2024 Earnings Call Transcript — as of May 7, 2024: The Motley Fool
Datadog 2024 Investor Day presentation — as of Feb 15, 2024: Slideshare mirror
Disclaimer
Educational content, not investment advice.
Excellent breakdown of Datadog's economic moat through the lens of multi-product adoption and cash flow conversion. The progression from 50% of customers using 4+ products to 26% using 6+ products really underscores the sticky data gravity effect you described - once teams integrate multiple observability, security, and service management modules, the switching costs become quite substantial. The 29-33% FCF margins combined with 83% gross margins demonstrate impressive unit economics at scale. Your point about Q1 billings seasonality is particularly important for investors to understad - many might misinterpret Q2-Q4 normalization as structural weakness when it's really just timing. Also appreciate the focus on dilution discipline and tracking FCF per share rather than just aggregate FCF - that's the right framework for evaluating shareholder value creation in high-SBC SaaS companies.
This is hands-down the best operational deep dive I've read on DDOG. The capitalized R&D + S&M approach for adjusted ROIC is exactly the right framework - treating growth investments as expensed understates true economic returns by inflating the denominator (invested capital appears artificially low). Your point about usage-based pricing adding volatility but amplifying upside when data growth resumes is crucial and frequently misunderstood by investors who overweight quarterly noise. The multi-product adoption progression (50% @ 4+, 26% @ 6+, 12% @ 8+) combined with >850 integrations really crystallizes the data gravity moat - once you instrument your entire observability stack through Datadog agents, the switching costs become prohibitive (dashboards, alerting logic, runbooks, institutional knowledge). The 83% gross margin with 29% FCF margin shows they're not burning capital to grow. What's particulary interesting is the Q1 billings seasonality dynamic you highlighted - investors who panic on Q2-Q4 FCF normalization are missing the structural cash conversion strength. The SBC dilution lens (tracking FCF/share vs absolute FCF) is essential discipline that most SaaS bulls conveniently ignore. One question: given the 2029 convertible notes (0% coupon), how are you modeling the dilution impact under different share price scenarios? That overhang matters for per-share compounding.