
Lessons from Amazon’s CCC: The Negative Working Capital Edge

Strong businesses don’t just earn attractive margins—they turn profits into cash quickly and predictably. The cash conversion cycle (CCC) is the bridge between accounting earnings and cash in the bank.
In this explainer, we map DSO, DIO, and DPO to free cash flow, illustrate how Amazon’s negative CCC works, and provide a checklist to evaluate working capital quality through a quality-investing lens.
TL;DR
CCC measures how fast your operating model converts investments in receivables and inventory into cash, net of supplier financing (payables).
The formulas are simple; the interpretation is not. A negative CCC can be a durable advantage—or a red flag—depending on moat, customer mix, and returns/chargebacks.
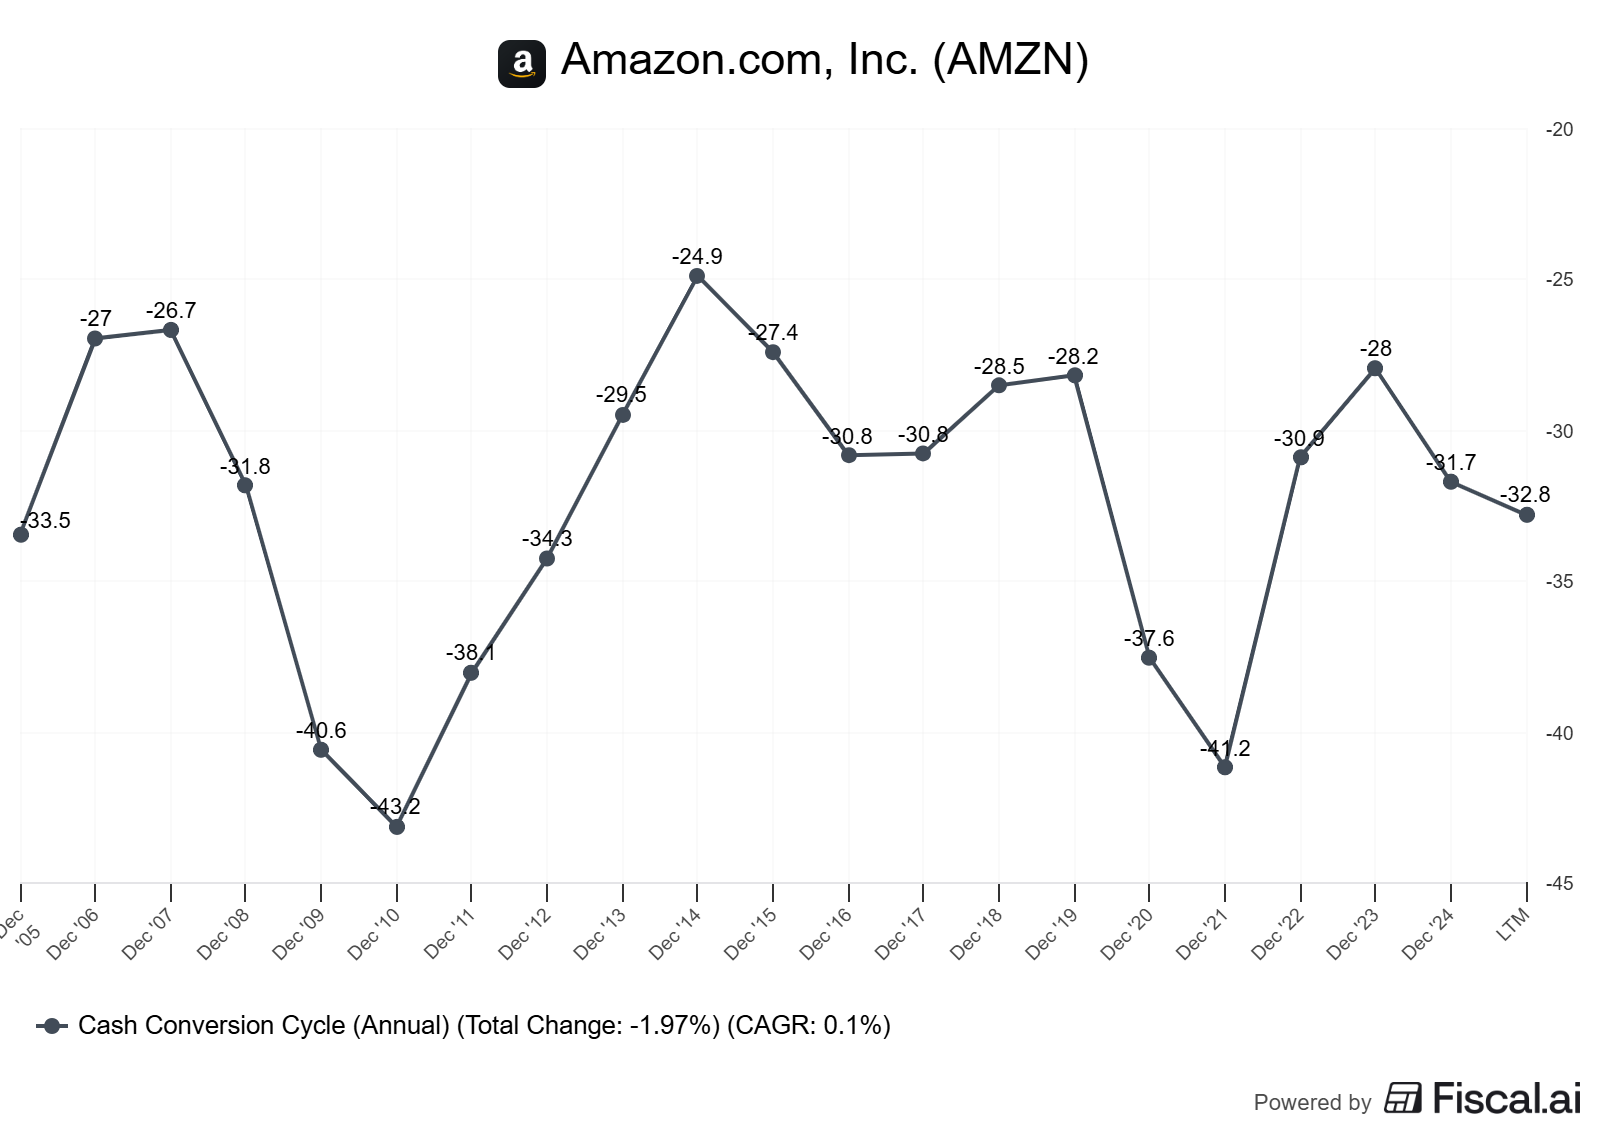
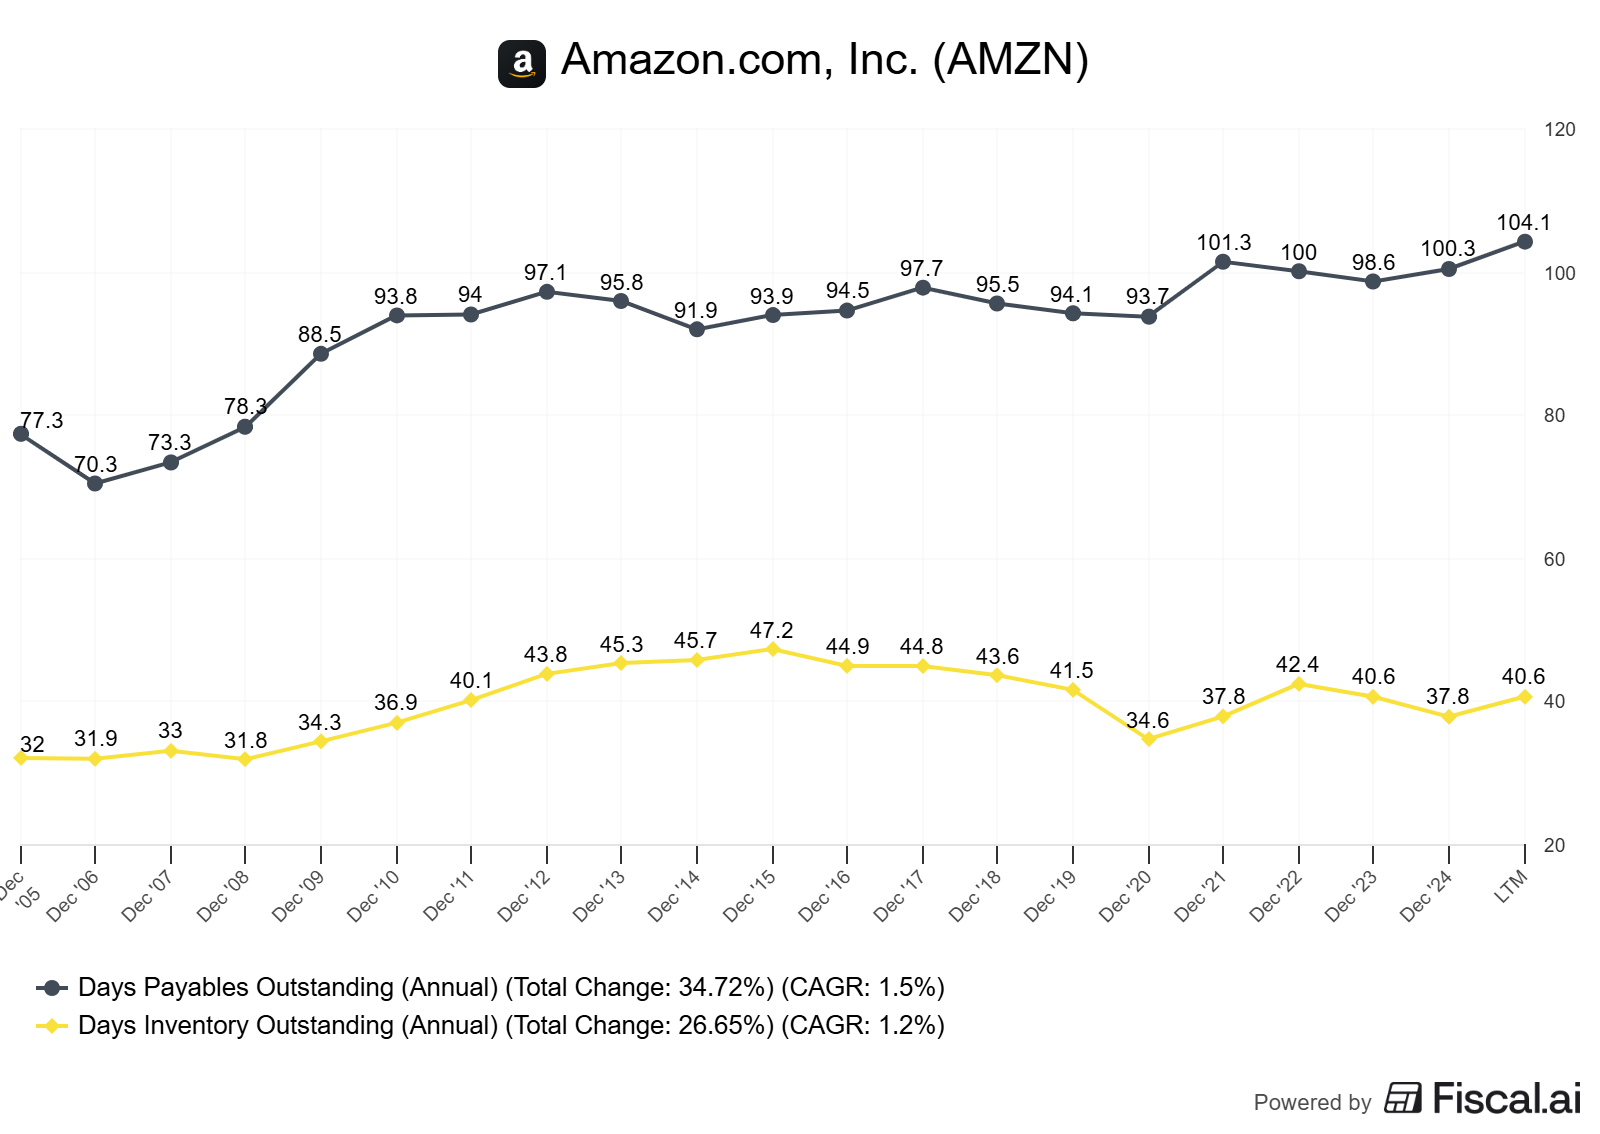
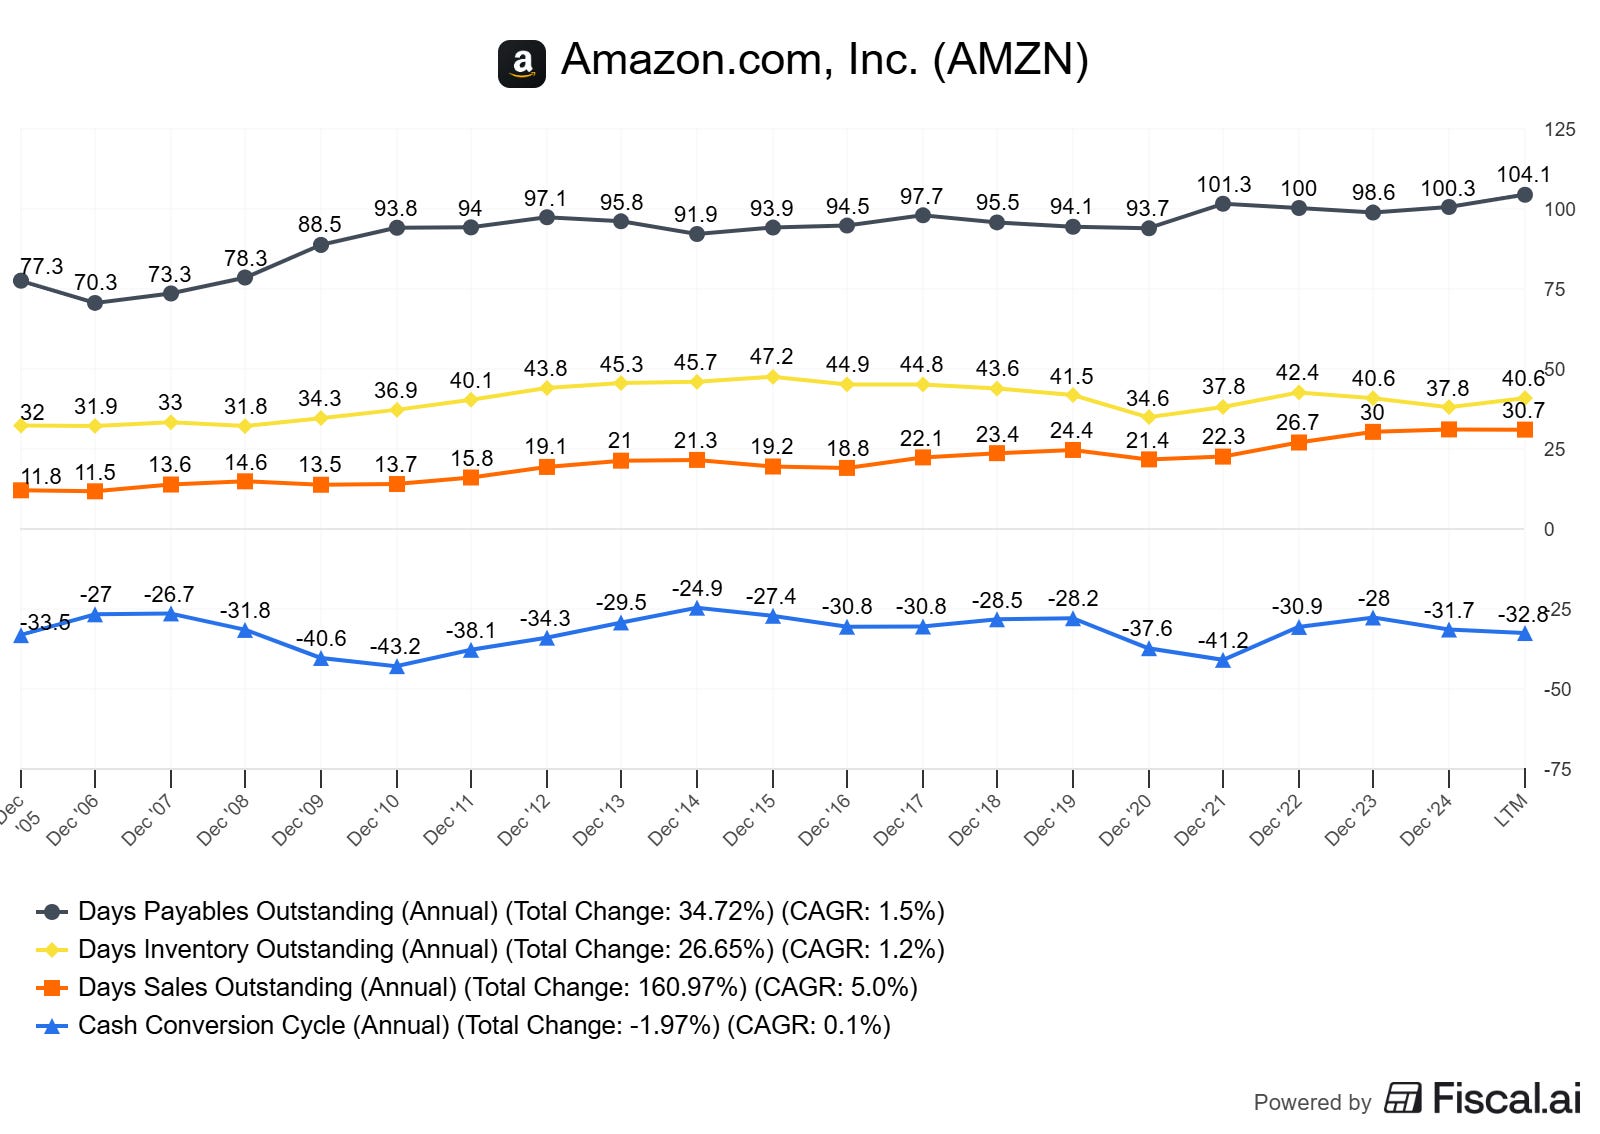
Amazon’s retail operations benefit from a structurally negative CCC driven by large payables to suppliers and fast inventory turns; the marketplace model and AWS have different dynamics.
Quality investors care about CCC because it drives FCF conversion, reduces capital intensity, and can boost ROIC when durable.
Use decision rules: prefer stable/improving CCC with evidence of pricing power/retention; stress-test returns and seasonality; adjust for “working capital loans” to customers/suppliers.
Build per-share FCF thinking: good CCC that funds growth internally plus disciplined share count is a powerful compounding engine.
Why it matters
Free cash flow (FCF) funds reinvestment, buybacks, and optionality. Two companies with identical earnings can have very different FCF because of working capital. CCC is often the swing factor.
Base rates:
Across sectors, CCC varies widely. Retailers with strong bargaining power and fast turns can run negative CCC; software with deferred revenue also benefits. Hardware and distributors with slow turns and thin margins often struggle.
Improving CCC sustainably (not via one-off stretching payables) can lift FCF conversion by several hundred basis points of sales. That supports higher reinvestment rates without external capital, improving compounding.
Where investors go wrong:
Treating negative CCC as always “good” without validating durability and customer experience (returns, chargebacks).
Ignoring segment differences: one unit can subsidize another.
Missing the link to ROIC: CCC improvement is a form of capital efficiency that can raise return on invested capital when stable.
Core concepts (quality-investing angle)
ROIC vs WACC and value creation
ROIC (return on invested capital) should exceed WACC (weighted average cost of capital).
Working capital sits in the “invested capital” denominator. Faster cycles require lower working capital per dollar of revenue. That raises ROIC if margins hold.
CCC that improves while margins remain stable is a green flag for quality.
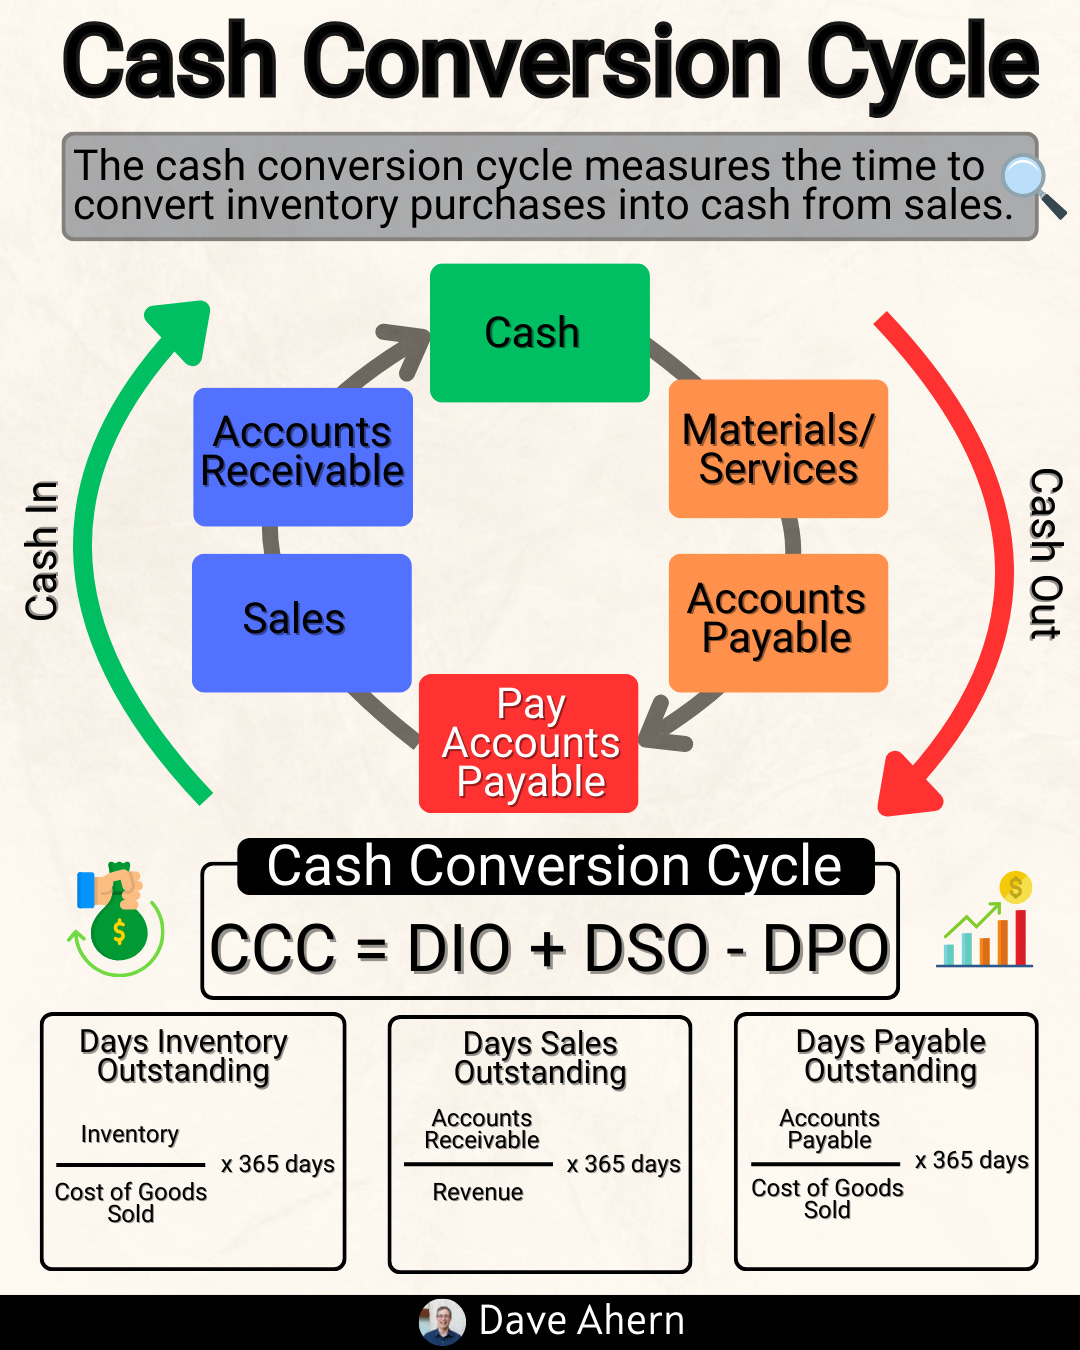
Key formulas:
ROIC = NOPAT ➗ (Net Working Capital + Net PP&E + Other Operating Assets - Operating Liabilities
CCC = DSO+DIO−DPO
DSO = Accounts Receivable ➗ Sales × 365
DIO = Inventory ➗ COGS × 365,
DPO = Accounts Payable ➗ COGS × 365
Reinvestment runway and capital intensity
Longer runways benefit from self-funding. A short or negative CCC lowers external funding needs.
High capital intensity (e.g., heavy logistics or data centers) can offset CCC benefits; always consider both working and fixed capital.
Unit economics and per-share metrics
Unit economics: contribution margin and payback period. CCC affects cash payback even when accounting payback looks fine.
Per-share framing matters: strong FCF conversion, combined with disciplined share count, compounds FCF/share. Adjust for SBC (stock-based compensation) to see true owner economics.
Moat durability and evidence (not claims)
Durable negative CCC often comes from bargaining power, switching costs, and platform scale. Evidence: stable or improving DIO, high DPO without supplier distress, low returns/chargebacks, and steady service levels.
[Infographic: Quality Lens: FCF Conversion Pyramid — purpose: show layers: 1) Unit margins/pricing power, 2) Working capital turns (CCC), 3) Capex discipline, 4) Share count — label how each layer drives FCF/share growth]
Mode-specific focus: Infographic Wednesday
Visual-first: frameworks, checklists, decision trees.
Decision trees help separate “good negative CCC” from “pulling-forward cash.”
Worked example or mini case using Amazong (AMZN)
Focus: Amazon (NASDAQ: AMZN), US.
Why: A canonical case of structurally favorable working capital in retail/marketplace, with segment differences (AWS, 1P retail, 3P marketplace).
What to know:
Retail/Marketplace: High payables (DPO) and fast inventory turns (DIO) drive a negative or short CCC. Marketplace also has timing benefits and lower inventory risk (for 3P).
AWS: Different profile—more deferred revenue and receivables; capital-intensive with data centers; CCC interacts with large capex and depreciation.
Signals from filings:
Amazon highlights operating cash flow impacted by changes in working capital, including payables and receivables, as well as lease/lease-like obligations and capex for infrastructure (AWS, logistics).
Over multi-year periods, Amazon’s DPO has been elevated vs peers, and inventory turns improved with scale in logistics. Marketplace mix and Prime scale help with demand predictability and supplier terms.
Caution: Returns, seasonal bulges in inventory and payables, and high growth capex mean FCF can be lumpy year to year.
Caveats and alternative interpretations:
Negative CCC can be partly seasonal. Year-end payables bulges unwind in Q1.
Supplier pushback is a risk if terms become punitive; watch vendor metrics and fulfillment performance.
Marketplace (3P) vs 1P inventory ownership changes DIO math.
AWS has different drivers: deferred revenue, receivables from enterprise customers, and large non-cancellable capex commitments.
Citations: See Amazon’s 10-K discussion of liquidity, cash flows, and commitments for FY2024 (as of 2024-12-31) for detailed context and reconciliations from GAAP to operating/FCF metrics (Amazon 2024 Form 10-K).
How to do this yourself (step-by-step guide)
Data to gather (10 years if possible):
Income Statement: Revenue, COGS, operating income.
Balance Sheet: Accounts receivable (A/R), Inventory, Accounts payable (A/P), Other operating liabilities.
Cash Flow Statement: Operating cash flow (OCF), Capital expenditures (capex), Lease repayments.
Share count, SBC expense, and buybacks.
Segment disclosures (for mix).
From: 10-K/20-F, investor presentations, supplemental tables.
Exact checks/calculations:
Compute DSO, DIO, DPO using average balances (beginning and ending) when possible:
DSO = Average A/R ÷ Revenue × 365
DIO = Average Inventory ÷ COGS × 365
DPO = Average A/P ÷ COGS × 365
CCC = DSO + DIO – DPO
Track trends and volatility; annotate seasonality.
Tie CCC changes to OCF: reconcile OCF YoY with working-capital changes.
Adjust FCF for lease principal repayments if you treat leases as financing or operating; be consistent.
ROIC bridge: show how working capital efficiency changes invested capital.
Per-share: compute FCF/share, EPS, and share count; adjust FCF for SBC if you treat SBC as a real cost (through dilution).
Decision rules and thresholds:
Prefer sustained ROIC – WACC > 5% with stable or improving CCC.
Negative CCC is attractive when supported by:
Consistently high DPO without supplier distress.
Stable/declining DIO and strong inventory turns.
Low returns/chargebacks relative to sales.
Predictable demand (membership, subscriptions, or scale).
Be cautious when CCC improvement is a one-time cash grab (e.g., significantly stretching payables in a single year).
For per-share compounding, target FCF conversion of over 80% over the cycle for asset-light segments and 50–60% for heavier models, with a stable share count or net buybacks when valuation allows.
Pitfalls and false positives (what commonly misleads investors)
Seasonal mirages: Year-end negative CCC that normalizes in the off-season.
Supplier squeeze: Extending DPO at the cost of vendor relationships and service levels.
Returns and shrink: Low DIO but high returns/shrink reduce true cash quality.
Channel mix shifts: Marketplace vs first-party changes balance-sheet footprint.
Capex gravity: Great CCC, but capex intensity so high that FCF still lags.
Accounting classification quirks: Deferred revenue and other liabilities impact OCF, making “working capital” look better than economic reality.
Checklist / one-pager
Compute DSO/DIO/DPO and CCC using average balances.
Trend 5–10 years; annotate big shifts with business events (mix, logistics investments).
Validate durability: supplier health, inventory turnover, return rate, and customer retention.
Reconcile OCF YoY with working capital; identify one-offs.
Build an ROIC bridge: show working capital impact on invested capital.
Assess capital expenditure intensity and lease commitments; compute the sensitivity of “owner earnings”.
Per-share discipline: FCF/share growth and share count trend; adjust for SBC.
Decision rule: Favor businesses with stable or improving CCC paired with pricing power, retention, and ROIC – WACC > 5%.
Glossary
DSO: Days sales outstanding; how long to collect cash from customers.
DIO: Days inventory outstanding; how long inventory sits before sale.
DPO: Days payables outstanding; how long you take to pay suppliers.
CCC: Cash conversion cycle; DSO + DIO – DPO; lower is better for cash.
ROIC: Return on invested capital; cash returns on operating capital employed.
WACC: Weighted average cost of capital; hurdle rate for value creation.
FCF Conversion: Free cash flow ÷ net income or OCF ÷ EBITDA; efficiency of turning earnings into cash.
Owner Earnings: Buffett-style FCF: OCF – maintenance capex (and often lease principal), adjusted for normalized working capital.
Further reading
Amazon 2024 Form 10-K (filed Feb 2025): Liquidity and Capital Resources; Working Capital discussion (2024-12-31).
McKinsey Valuation, 7th ed.: Working capital and value creation (2020).
Damodaran, “Working Capital and Valuation” notes (updated periodically).
Deloof (2003), “Does Working Capital Management Affect Profitability?” Journal of Business Finance & Accounting.
Petersen & Rajan (1997), “Trade Credit: Theories and Evidence,” The Review of Financial Studies.
References
Amazon.com, Inc. Form 10-K for the year ended Dec 31, 2024 (as filed Feb 2, 2025). “Liquidity and Capital Resources,” “Cash Flows,” and financial statements. As of 2024-12-31. https://www.sec.gov/ixviewer/doc?action=display&source=content&source_location=Search%20Results&file=https%3A%2F%2Fwww.sec.gov%2FArchives%2Fedgar%2Fdata%2F0001018724%2F000101872425000006%2Famzn-20241231.htm
McKinsey & Company, Valuation: Measuring and Managing the Value of Companies, 7th Edition (2020). As of 2020-01-01.
Aswath Damodaran, NYU Stern, “Working Capital and Valuation” teaching notes. As of 2024-09-01. http://pages.stern.nyu.edu/~adamodar/
Deloof, Marc. “Does Working Capital Management Affect Profitability?” Journal of Business Finance & Accounting, 30(3-4), 2003. As of 2003-06-01.
Petersen, Mitchell A., and Raghuram G. Rajan. “Trade Credit: Theories and Evidence.” The Review of Financial Studies, 10(3), 1997. As of 1997-07-01.
Closing thought
For quality investors, CCC is not a footnote. It’s a diagnostic for durability, capital discipline, and the ability to compound without constant external funding. Amazon’s model demonstrates how a structurally favorable CCC, combined with scale and mix, can improve FCF conversion and capital efficiency. Use the frameworks and checklists above to distinguish between durable cash engines and temporary float.
Educational content, not investment advice.