
How to Value Companies at Different Lifecycle Stages
Why One-Size-Fits-All Valuation Doesn't Work

One of the most common mistakes I see investors make is applying the same valuation metric to every company they analyze. They pull up the P/E ratio, compare it to the S&P 500 average, and call it a day. But here’s the thing: that approach can lead you seriously astray.
The reality is that companies at different stages of their business lifecycle require fundamentally different valuation approaches. A high-growth company that reinvests every dollar into expansion will look “expensive” on traditional metrics. A mature cash cow might look “cheap” but have limited upside. And a company in turnaround mode? Traditional metrics might not apply at all.
In today’s post, we will learn:
Why lifecycle stage matters for valuation
How to value early-growth companies (CrowdStrike example)
Alternative metrics for high-growth reinvestors (Amazon example)
Traditional valuation for mature businesses (Microsoft, Visa examples)
Valuing declining or turnaround situations (Intel example)
Okay, let’s dive in and learn more about lifecycle-based valuation.
Why Lifecycle Stage Matters
Think about it this way: would you evaluate a startup the same way you’d evaluate Coca-Cola? Of course not. Yet investors routinely apply identical metrics across companies at vastly different stages.
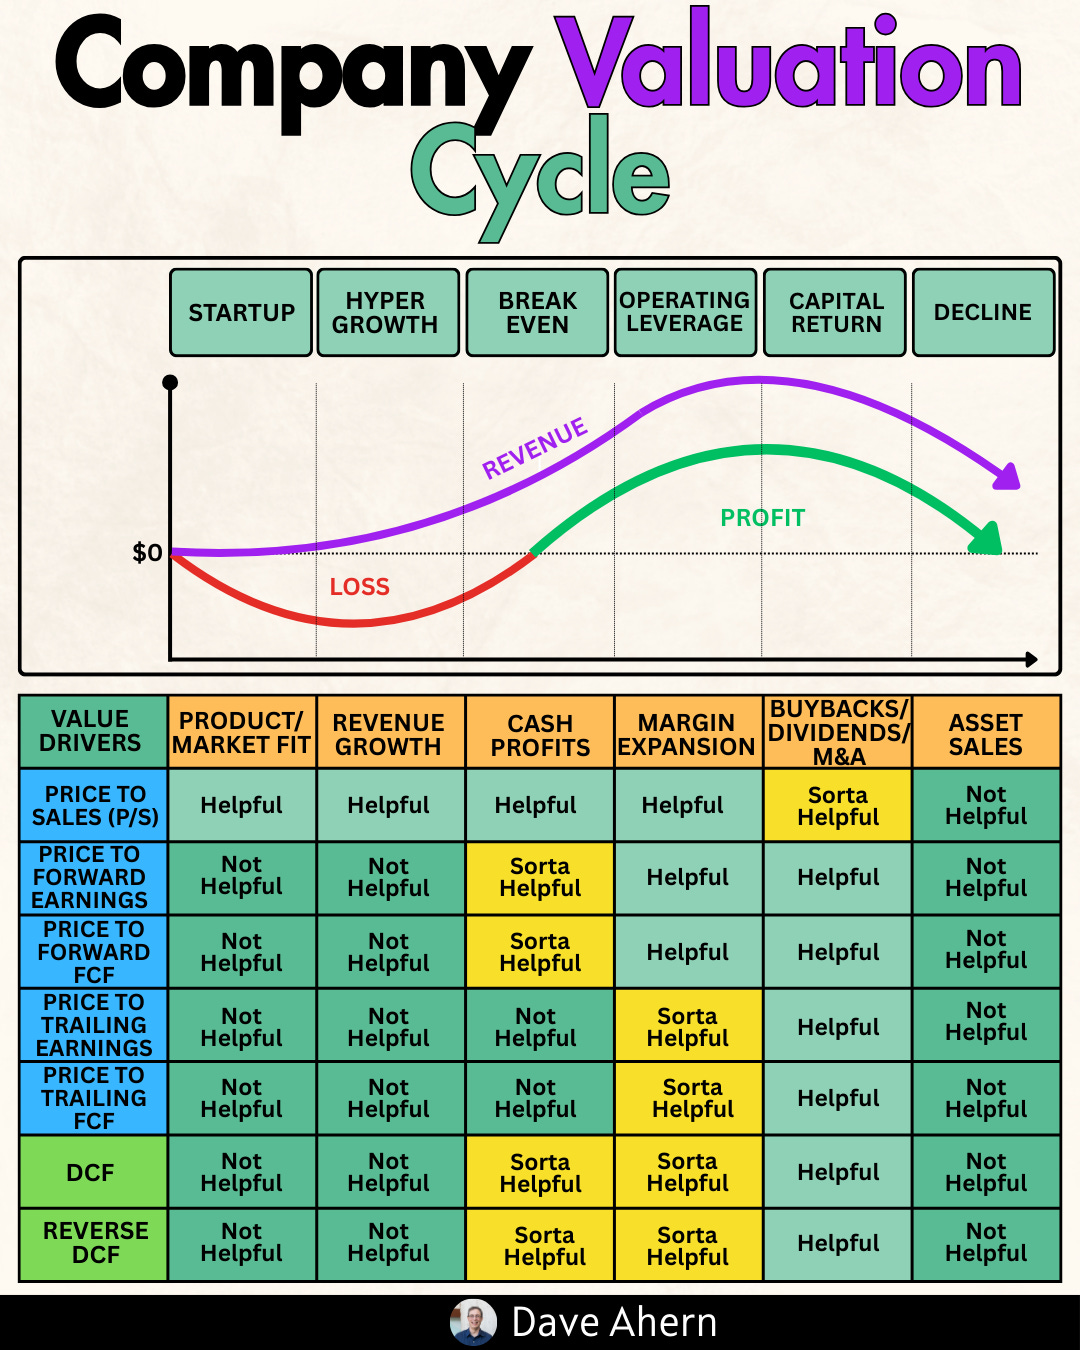
Companies generally move through four distinct phases, each requiring its own valuation lens:
Early Growth: Pre-profit or minimal profit companies focused on capturing market share. Traditional P/E ratios are often meaningless or negative.
High Growth: Rapidly expanding companies reinvesting heavily in infrastructure. Free cash flow may be suppressed by capital expenditures.
Mature: Established businesses with predictable earnings and strong cash flow conversion. Traditional metrics work well here.
Declining/Turnaround: Companies facing structural challenges, restructuring, or attempting to reinvent themselves. Past performance misleads.
Let’s walk through real examples to see how this works in practice. I promise it isn’t as complicated as it sounds.
Early Growth Stage: CrowdStrike
CrowdStrike represents a classic early-growth company. It’s a cybersecurity leader growing revenue rapidly while investing heavily in customer acquisition and product development.
Let’s look at the numbers from their fiscal 2025 10-K (year ending January 31, 2025):
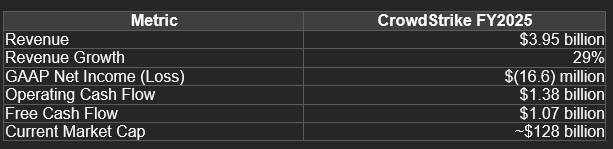
Notice the apparent contradiction: CrowdStrike shows a small GAAP net loss, yet generates over $1 billion in free cash flow. What gives?
The answer is stock-based compensation. High-growth tech companies pay employees heavily in stock, which creates large non-cash expenses that depress GAAP earnings. This is why P/E ratios often mislead in early-growth situations.
Better metrics for early-growth companies: Price-to-Sales (P/S), EV/Revenue, or Price-to-Free-Cash-Flow. CrowdStrike trades at roughly 32x revenue and 120x free cash flow—expensive by any measure, but the company is growing 29% annually with improving margins.
High Growth Stage: Amazon
Amazon exemplifies the high-growth reinvestor. For years, critics called Amazon “overvalued” because its P/E ratio was astronomical or nonexistent. Those critics missed that Amazon was deliberately suppressing profits to invest in AWS infrastructure and logistics.
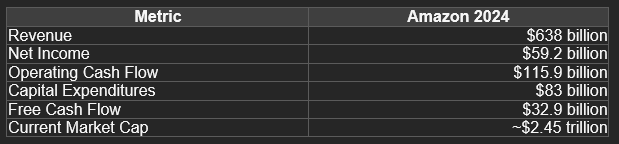
Look at that CapEx figure: $83 billion! Amazon is spending massive amounts building data centers, warehouses, and logistics infrastructure. This explains the gap between operating cash flow ($115.9 billion) and free cash flow ($32.9 billion).
Better metrics for high-growth reinvestors: EV/EBIT or Price-to-Operating-Cash-Flow. These metrics capture the business’s earnings power before discretionary growth investments. Amazon trades at roughly 21x operating cash flow—much more reasonable than a pure P/E or EV/FCF analysis would suggest.
Mature Stage: Microsoft and Visa
Here ends the free part.
You've got the framework. Now let's see it in action with real companies at different lifecycle stages. Below: Microsoft, Visa, and Intel analyzed with actual SEC data—see exactly which valuation metrics work (and which mislead) at each stage.
