
How to Analyze the Income Statement Visually

So, you've decided to get serious about investing, and you want to start analyzing a company. You've probably heard people throw around terms like "P/E ratio" and "balance sheet." But let's start with something a little more straightforward: the income statement.
Think of the income statement as a company's financial report card for a specific period, like a quarter or a year. It shows how much money the company made and how much it spent. By understanding it, you can get a real sense of how profitable a business truly is.
Let's take a walk down the income statement, from top to bottom.
Starting at the Top: Gross Profit
First, you have Revenue (also called Sales). This is the total amount of money a company brings in from selling its products or services.
But, of course, it costs money to make things. The direct costs of producing a product—like raw materials and factory labor—are called the Cost of Goods Sold (COGS).
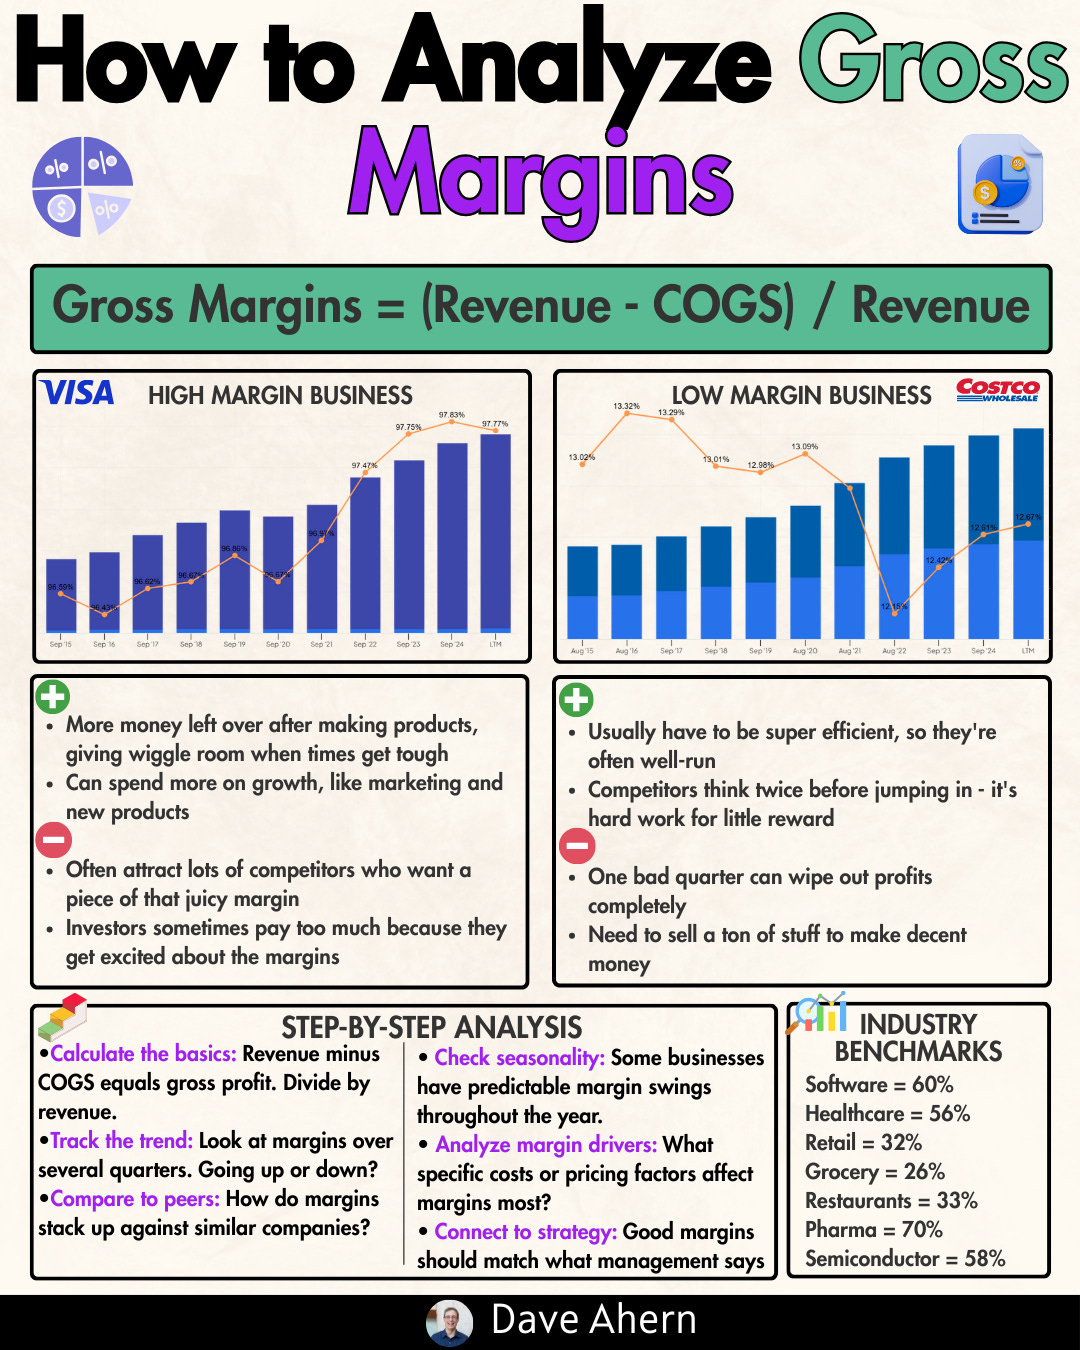
Subtract COGS from Revenue, and you get Gross Profit.
Revenue - Cost of Goods Sold = Gross Profit
This is the profit a company makes before accounting for any other business expenses. To make this more useful, we calculate the Gross Margin: (Gross Profit / Revenue) x 100. A high gross margin is great! It suggests the company has strong pricing power and can produce its goods efficiently.
The Middle Ground: Operating Income
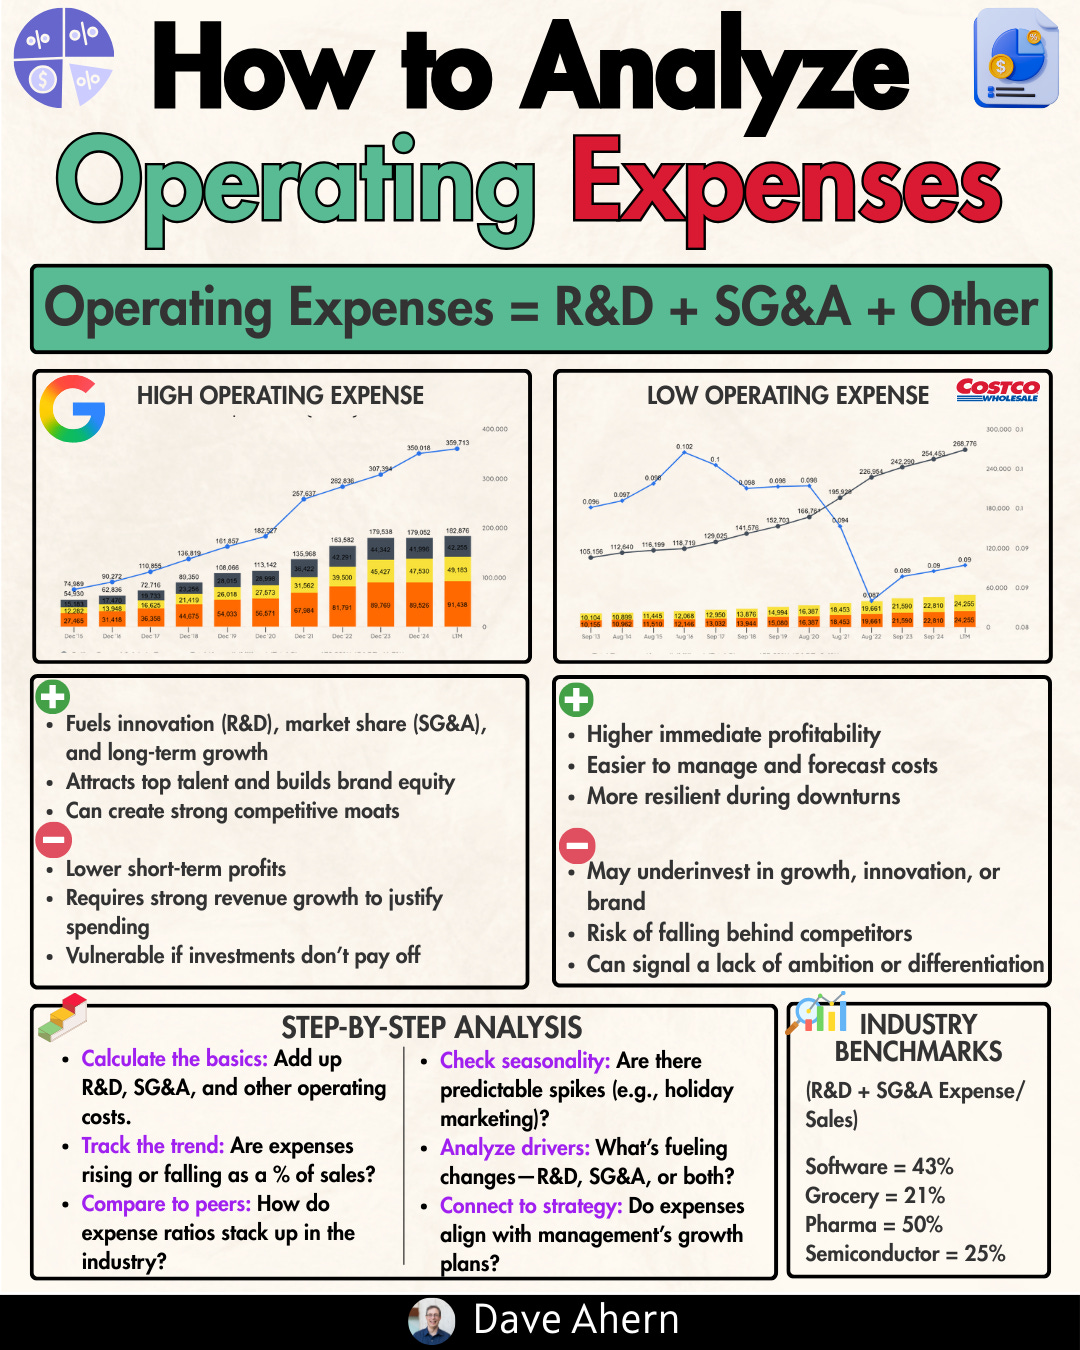
Next, we have to account for the costs of actually running the business. These are Operating Expenses, and they include things like marketing budgets, executive salaries, and office rent.
Subtract these from the Gross Profit, and you get Operating Income.
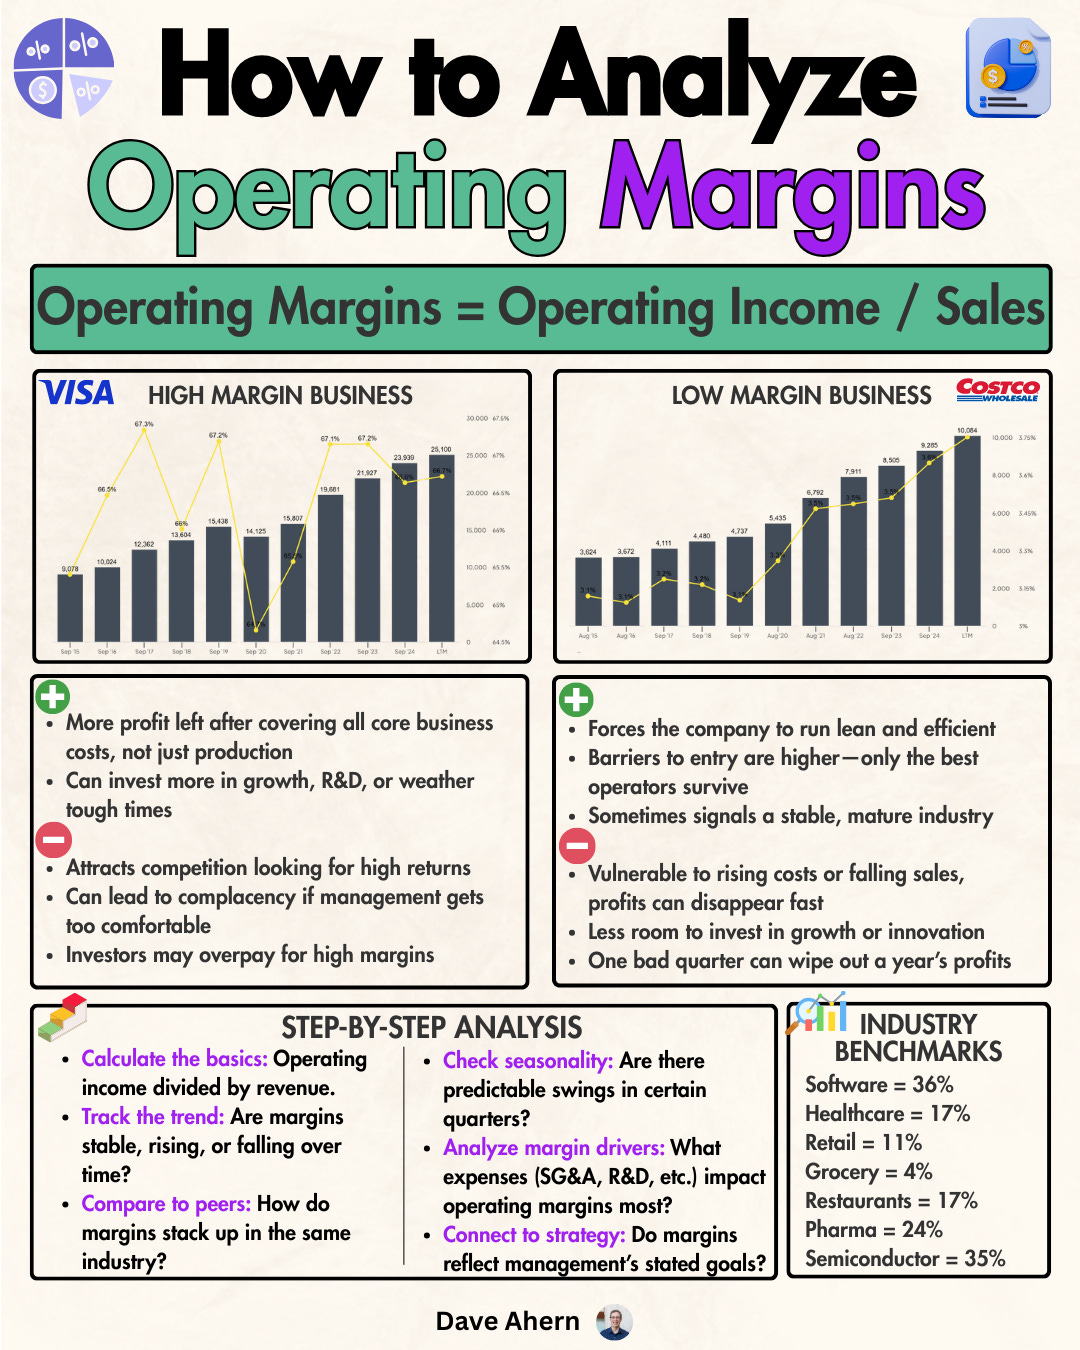
Gross Profit - Operating Expenses = Operating Income
This number is super important. It tells you how much profit the company is making from its core business operations, before things like taxes or interest payments are factored in.
The Operating Margin (Operating Income / Revenue) x 100 shows how good the company is at turning sales into pre-tax profit.
The Bottom Line: Net Income
We're almost there! After the operating income, companies have to pay for other things, mainly interest on their debt and, of course, taxes.
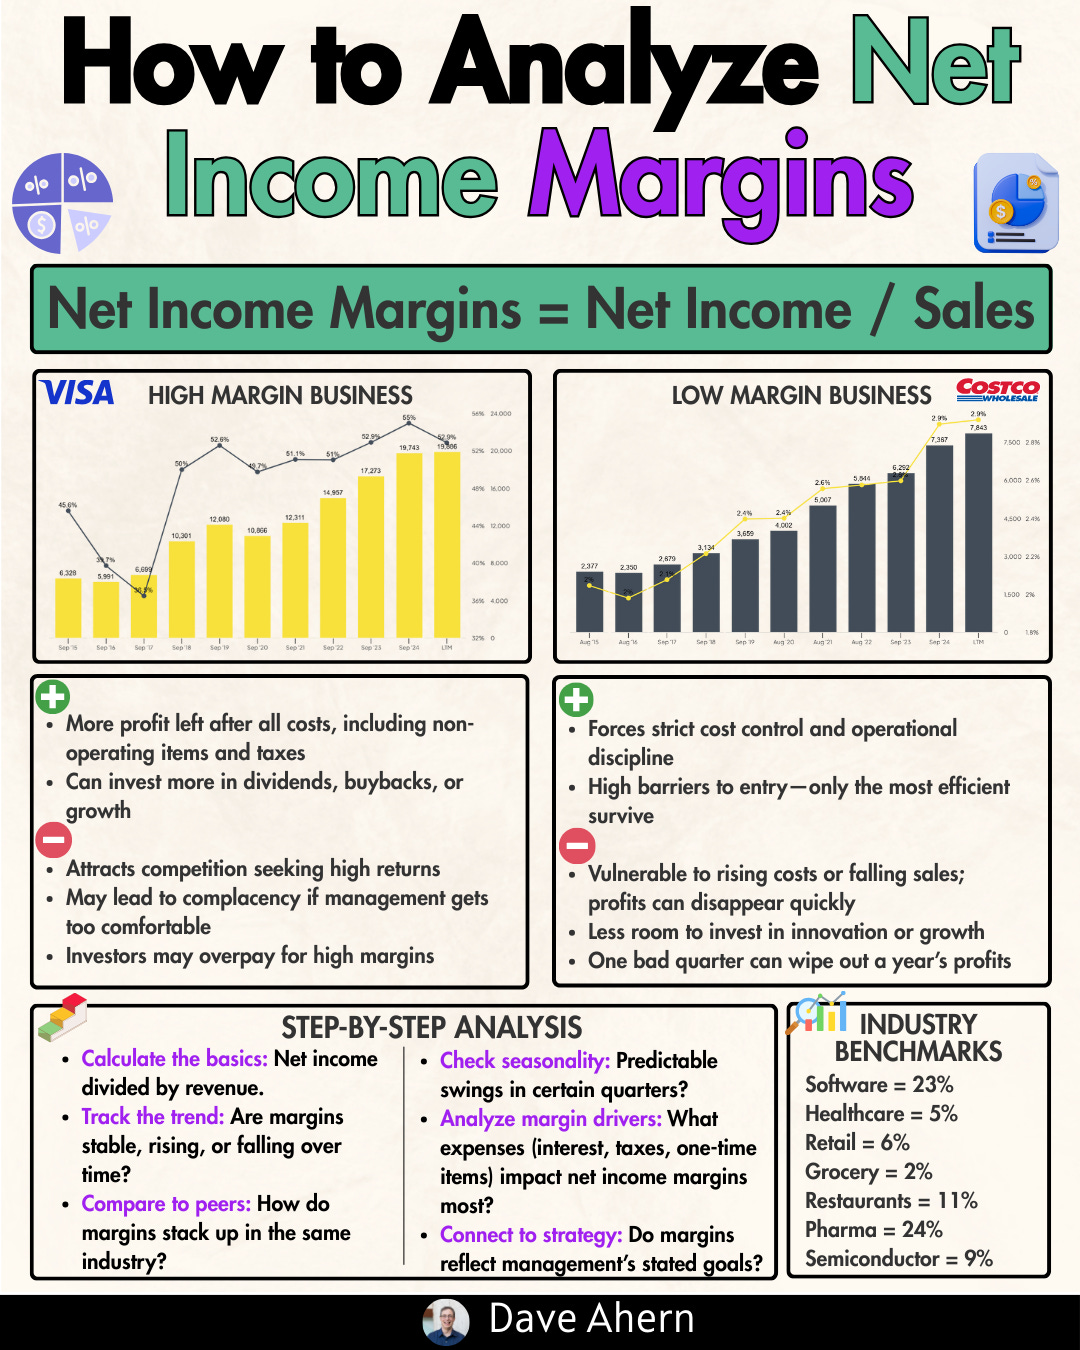
Once you subtract interest and taxes from the operating income, you finally arrive at the Net Income. This is the famous "bottom line." It's the profit left over for the company and its shareholders after every single expense has been paid.
The Net Profit Margin (Net Income / Revenue) x 100 tells you what percentage of every dollar in sales becomes pure profit.
By looking at these three margins—Gross, Operating, and Net—you can see exactly where a company is succeeding or struggling. Is their cost of production too high? Are they spending too much on marketing?
Analyzing the income statement helps you answer these questions and become a smarter, more informed investor.