
How Operating Leverage Really Works (And When It Bites): A Microsoft-Focused Explainer

Operating leverage is one of the cleanest ways to translate a growth view into P&L outcomes. It also amplifies mistakes.
Today’s article provides a visual toolkit and a simple playbook for measuring, stress-testing, and monitoring operating leverage, using Microsoft as a practical example.
TL;DR
Operating leverage = how fast operating income moves relative to revenue. It magnifies both wins and losses.
Quality lens: marry operating leverage with ROIC > WACC, reinvestment runway, cash conversion, and per-share discipline.
Measure with degree of operating leverage (DOL), cost structure mapping (fixed vs variable), and mid-cycle normalization.
Build 3 scenarios with clear drivers (pricing, mix, cost scaling) and watch for accounting quirks (capitalized costs, SBC).
Microsoft’s long-term margin and FCF strength reflect durable moats and scalable cost base, but AI capex and product-mix shifts change the slope of leverage.
Do this yourself: pull filings, compute DOL and ROIC-WACC spread, test sensitivity, and monitor per-share metrics and working-capital intensity.
Why it matters
Operating leverage connects strategy to outcomes. It is the mechanism by which growth, pricing power, and mix flow into operating income and, ultimately, free cash flow (FCF).
Where investors go wrong:
Confusing one-time cost takeouts with durable operating leverage.
Ignoring capital intensity and working capital. Operating leverage without cash conversion is a mirage.
Treating “software margins always go up” as a law. Product cycles, platform transitions, and investments (e.g., AI) change cost curves.
Not normalizing for cyclicality. Mid-cycle margins beat peak/trough point estimates.
Base rates to keep in mind:
Sector WACC context sets your hurdle. For US Computer Software, a recent cost of capital estimate is ~8–10% (category-level; varies by firm) NYU Stern Cost of Capital dataset, January 2025.
Quality firms show a spread: ROIC – WACC comfortably positive and persistent; operating margins tend to scale with revenue but decay if reinvestment is delayed or cost structure ossifies.
Core concepts (quality-investing angle)
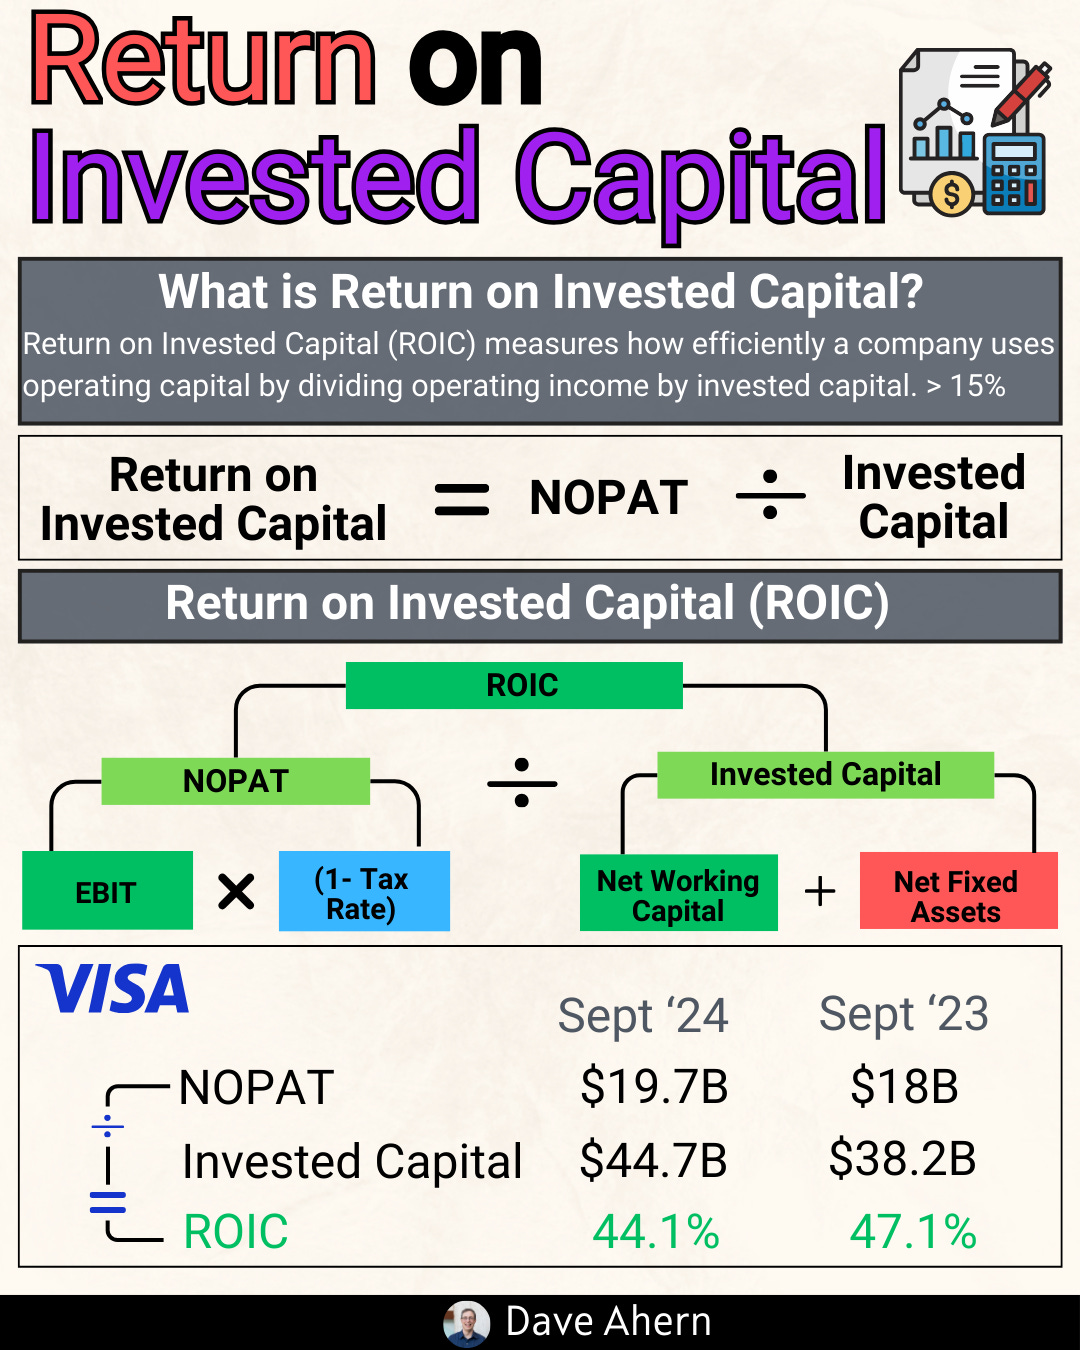
ROIC vs WACC and value creation
ROIC (return on invested capital) > WACC (weighted average cost of capital) is the bedrock of quality.
Operating leverage helps expand operating income on a stable asset base. But if leverage requires heavy new capex or rising working capital, ROIC can slip.
Decision rule: Prefer sustained ROIC – WACC > 5% across cycles; watch the direction and the reinvestment needed to sustain it.
Reinvestment runway and capital intensity
A long runway allows operating leverage to play out; heavy capital intensity can dilute it.
Cloud and AI datacenter expansion raises fixed costs up front but can deepen moats through scale and performance advantages.
Track capex as % revenue, data center spend, and capitalized software. Normalize multi-year.
Unit economics and per-share metrics
Unit economics (gross margin per unit/customer, LTV/CAC, cohort retention) reveal the foundations of leverage.
Per-share framing prevents “aggregate growth” hiding dilution via SBC or pricey M&A.
Decision rule: FCF per share CAGR >15% with stable share count is golden. If buybacks offset SBC only, don’t over-credit capital allocation.
Moat durability and evidence (not claims)
Evidence over slogans: recurring revenue mix, retention, multiproduct adoption, migration to higher-value tiers, ecosystem lock-in, and low churn are signals.
Watch revenue concentration and contract quality (e.g., remaining performance obligations, RPO, duration).
Worked example: Microsoft
Microsoft is a high-ROIC compounder with a scalable cost base and multi-segment diversification. It also faces a new fixed-cost profile with AI infrastructure that changes the slope of operating leverage.
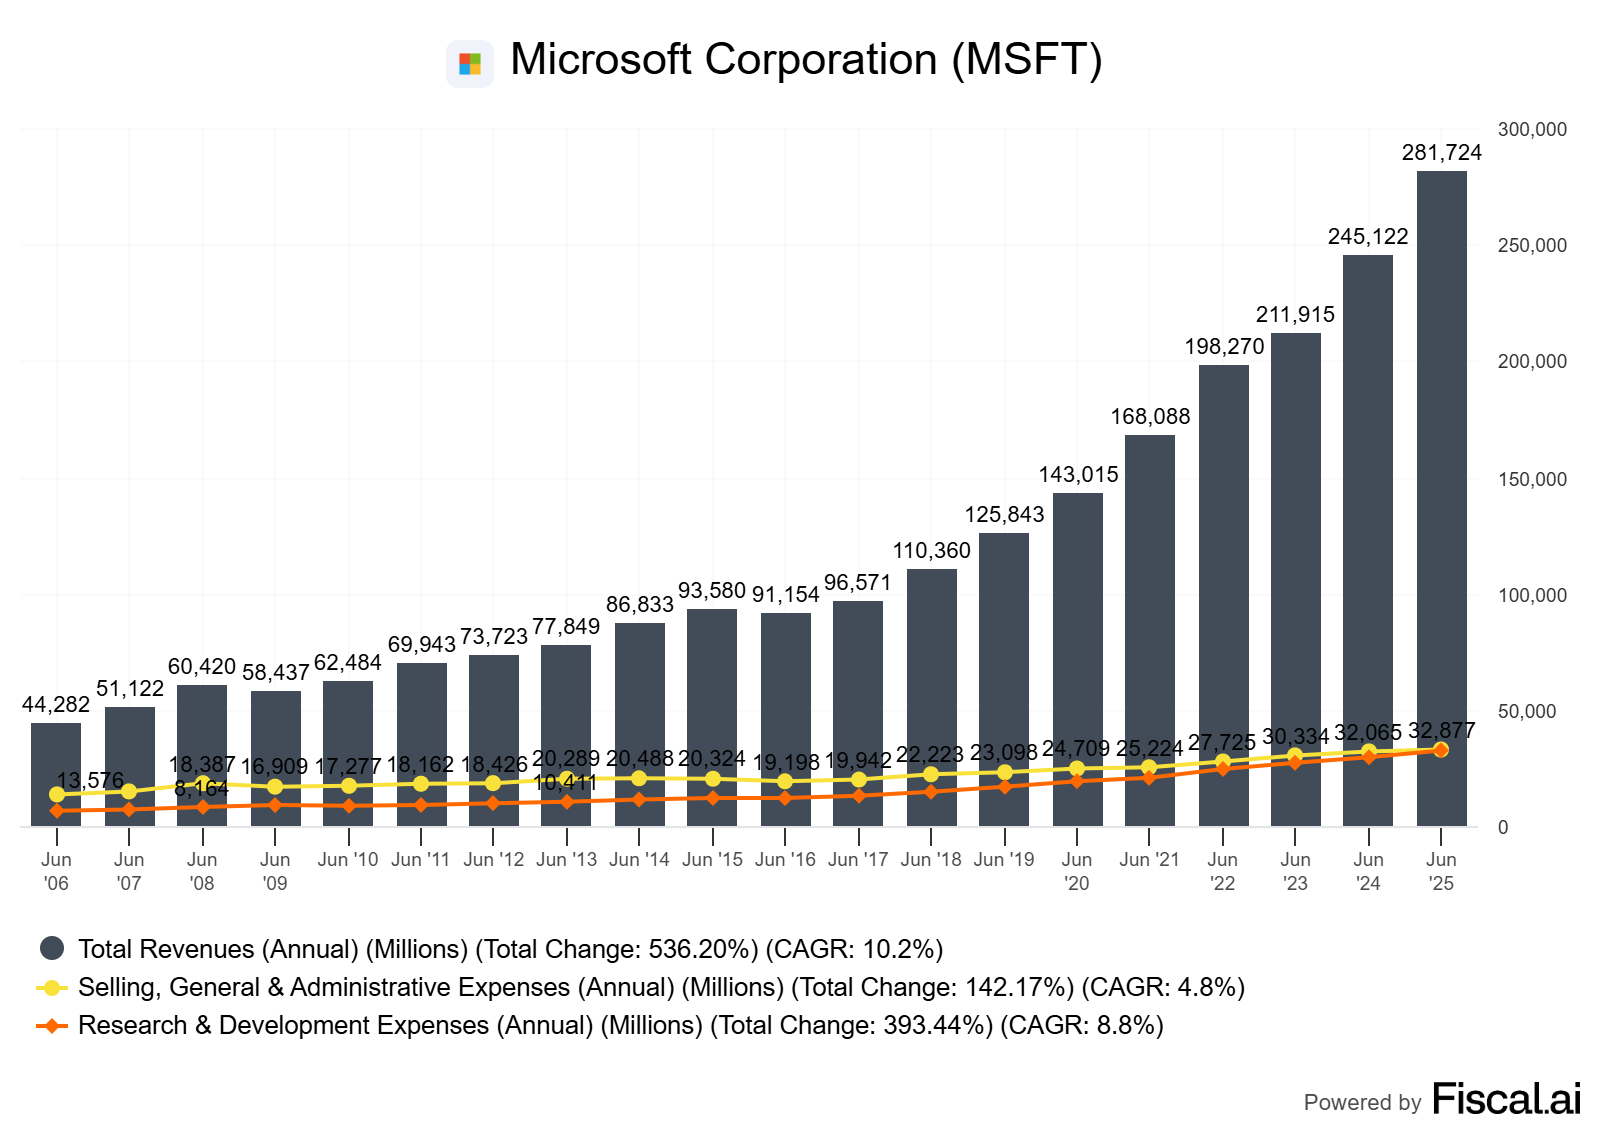
Selected facts (FY2024):
Revenue > $245 billion (+16% YoY), operating income > $109 billion (+24% YoY) Microsoft Annual Report 2024, as of Oct 18, 2024.
Shareholder returns: ~$12B repurchases (32M shares) and ~$22.3B dividends in FY2024 (total ~$34B), with $10.3B remaining under the 2021 $60B authorization as of June 30, 2024 (Annual Report 2024 — Share Repurchases and Dividends).
Segment dynamics: growth across Productivity & Business Processes, Intelligent Cloud, and More Personal Computing (FY24 vs FY23) per FY24 Q4 performance page Microsoft IR Performance FY24 Q4.
Operating leverage lens
Long-term trend: expansion of consolidated operating margin as cloud scaled and software mix deepened; devices/hardware cyclicality diluted but did not dominate group margins.
AI era: Datacenter capex raises upfront fixed costs. Over time, utilization and pricing can re-accelerate leverage if revenue growth remains robust.
Mix: Higher Azure/GitHub/Dynamics/365 share supports gross margin quality and recurring revenue base, partially offset by gaming/devices volatility.
Measurement
Degree of Operating Leverage (DOL):
DOL ≈ % change in operating income ÷ % change in revenue.
FY2024 showed operating income growing faster than revenue (+24% vs +16%), implying a DOL > 1 for the year. One year is noisy; compute over multi-year periods to see persistent scaling.Cost stack:
Fixed opex (R&D, S&M, G&A) scales sub-linearly in strong growth phases; COGS includes cloud infrastructure costs that scale with usage but require heavy base build-out.
Per-share framing
Dividends of $3.00 per share in FY2024 and continued repurchases support per-share value. Note that Microsoft also withholds shares to settle employee tax on vesting ($5.3B FY2024) — treat buybacks net of dilution Annual Report 2024.
Monitor FCF/share growth against share count drift.
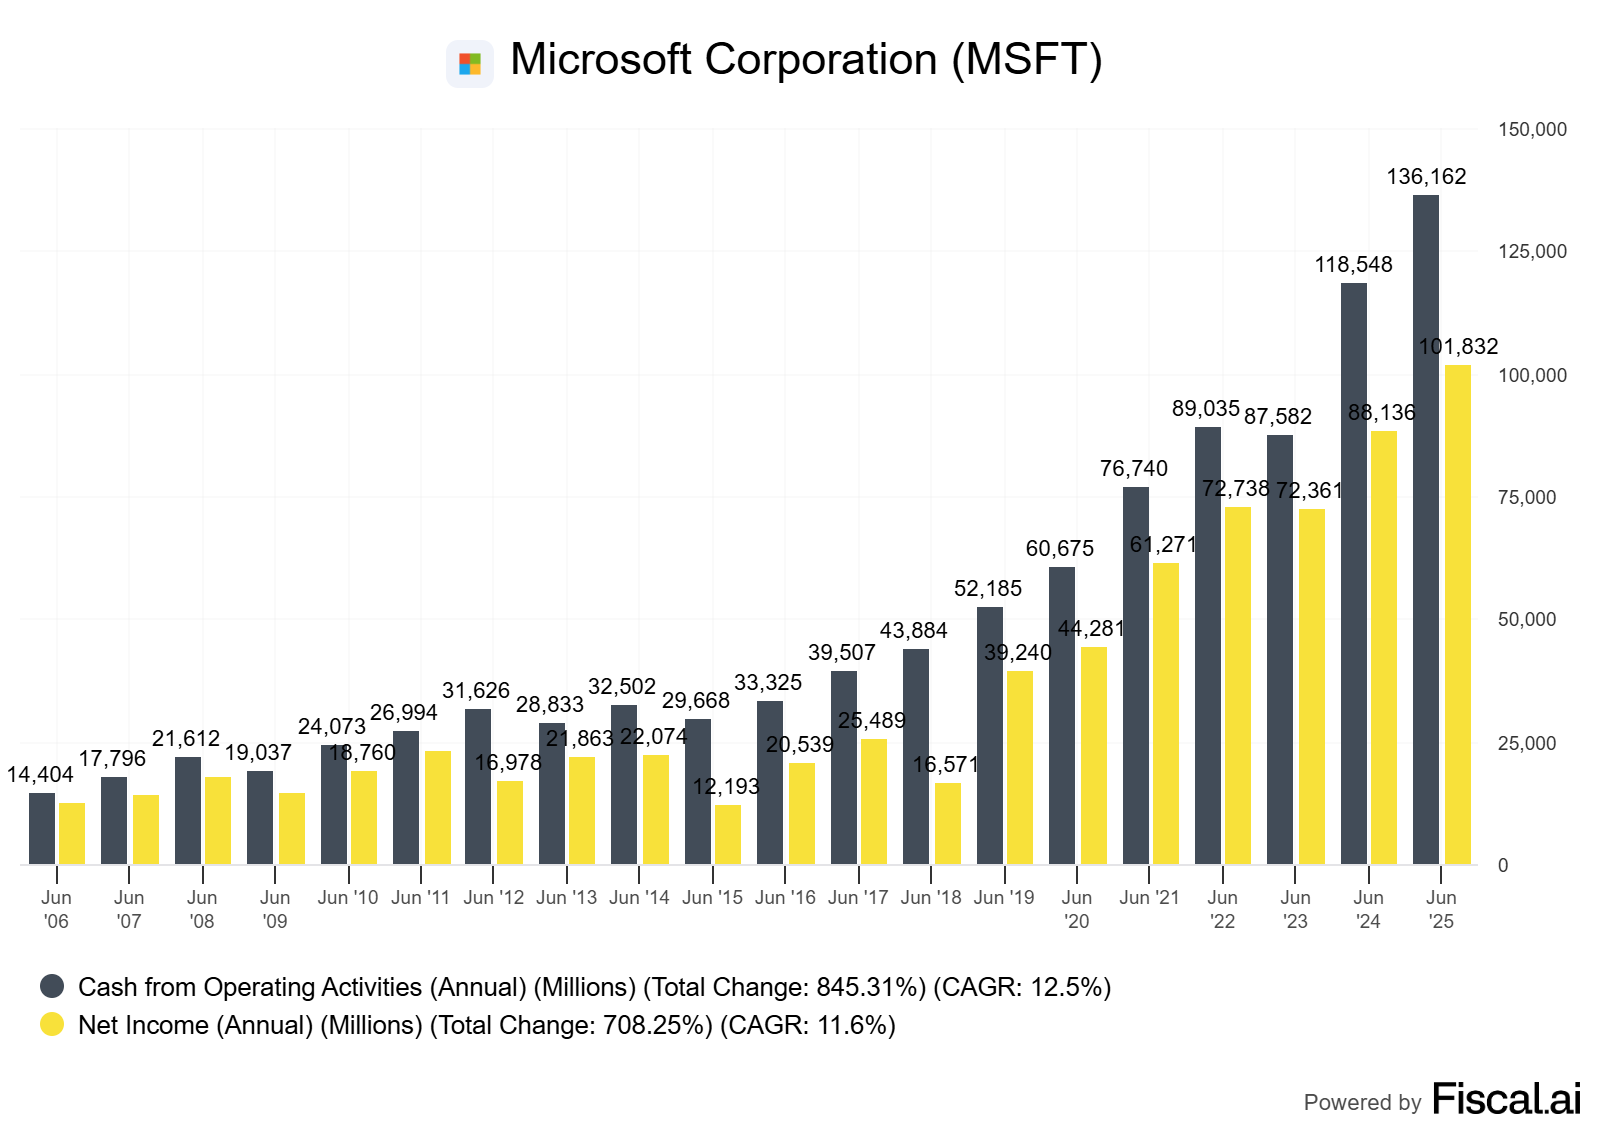
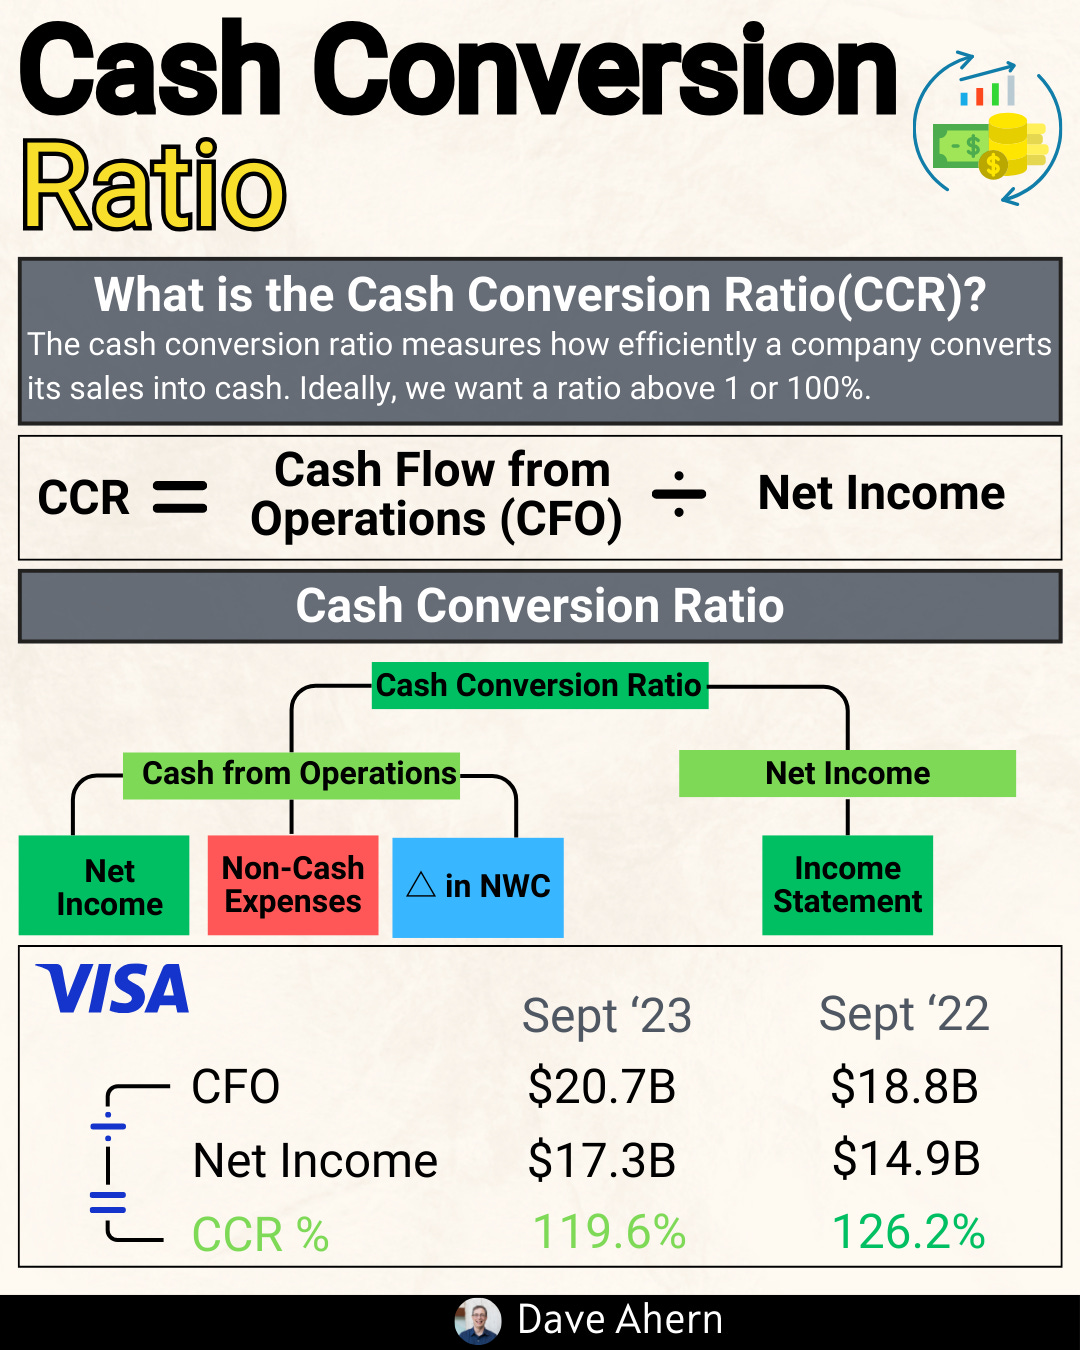
Cash conversion and working capital
Large software and cloud franchises typically show strong operating cash flow and low inventory intensity.
Watch deferred revenue/unearned revenue and RPO trends as proxies for future revenue visibility.
Microsoft’s scale and recurring mix support cash conversion; validate via the FY2024 cash flow statement (CFO – capex) and multi-year FCF margins in your model.
Moat evidence
Pricing power in Microsoft 365, multi-cloud workload migrations to Azure, developer ecosystem via GitHub, and enterprise switching costs create resilience.
Cross-sell and E5 mix shifts often improve ARPU and support operating leverage.
Caveats and alternative interpretations
AI capex bulge could compress near-term FCF margins; terminal economics depend on utilization, pricing, and competitive intensity.
Gaming and devices inject more volatility into consolidated margins; scenario analysis should segment through-cycle assumptions.
SBC and share withholding can offset headline repurchases; measure net share reduction.
How to do this yourself
Step-by-step
Gather data
Company filings: 10-K/20-F, 10-Q, Annual Report (income statement, cash flow, segment disclosure, capex, SBC, share repurchases/dividends). For Microsoft FY2024, see the Annual Report and FY24 Q4 performance pages Microsoft AR24, Microsoft IR FY24 Q4 Performance.
Market and WACC context: sector-level cost of capital ranges (e.g., NYU Stern dataset, Jan 2025).
Optional: reputable data providers for ROIC, FCF histories if you don’t want to compute from scratch.
Build a cost-stack view
Split costs into COGS (variable/semi-variable) vs opex buckets (R&D, S&M, G&A).
Identify fixed vs variable drivers. For cloud, remember fixed base (datacenters) with usage-linked variable layers.
Compute degree of operating leverage (DOL)
Annual: DOL_t = (%ΔOperating income) / (%ΔRevenue).
Multi-year: Use CAGR-based approximation over 3–5 years to smooth noise.
Segment-level where possible to see which lines provide the most leverage.
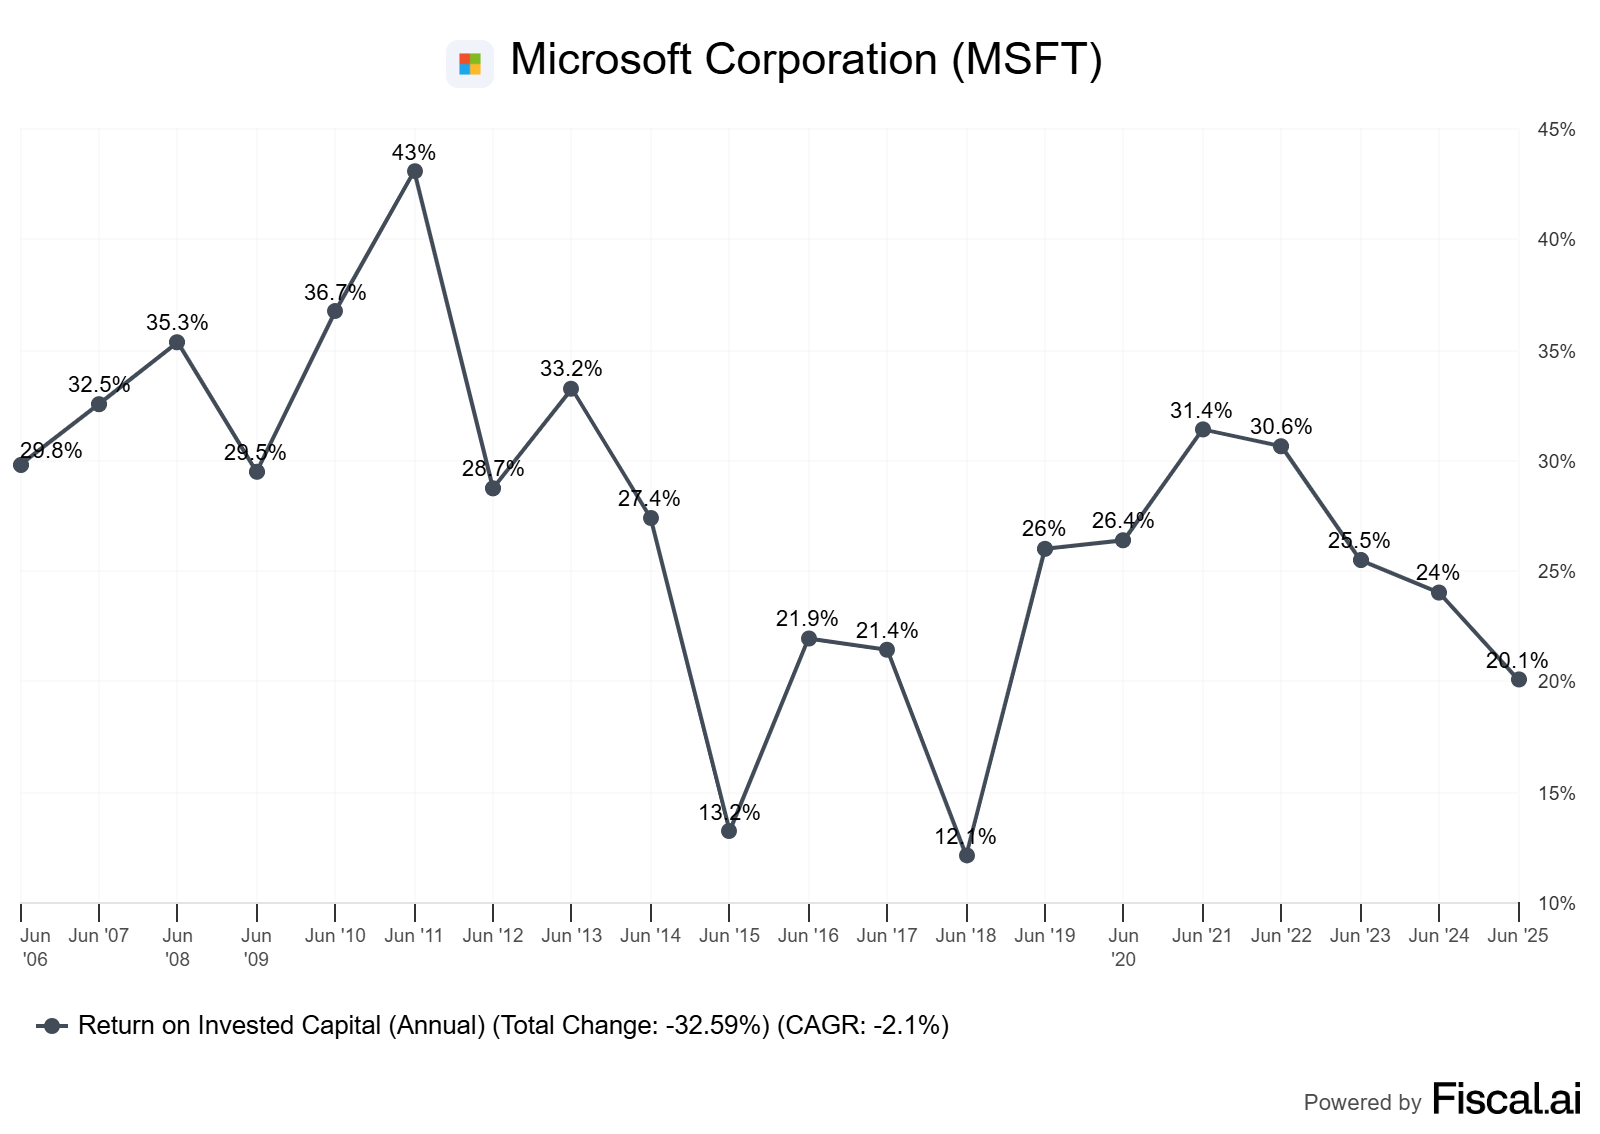
Tie to ROIC and reinvestment
Compute ROIC (NOPAT / Invested Capital). Compare to WACC.
Check whether margin gains require disproportionate capex or working capital.
Decision rule: Prefer sustained ROIC – WACC > 5% with stable/improving FCF conversion.
Per-share discipline
Track FCF/share, EPS, and share count.
Adjust for SBC and shares withheld for tax. Use “net buyback” (repurchases – SBC-related issuance/withholding).
Scenario design (3 cases)
Base: mid-cycle margin; prudent revenue growth; steady capex/sales; flat mix.
Bull: stronger pricing and mix shift to higher-margin segments; operating expense scaling; utilization gains in infrastructure.
Bear: slower growth or mild recession; price competition; cost absorption of fixed infrastructure; slower hiring freeze benefits limited.
Monitor and update
Quarterly: revenue mix, gross margin, opex growth vs revenue growth, capex cadence, RPO updates, headcount.
Annual: ROIC bridge, FCF conversion, net share count, capital allocation scorecard.
Decision rules and thresholds
Seek DOL persistently >1 with controlled volatility; avoid cases where a single segment’s cyclicality dominates.
Prefer ROIC – WACC > 5% across cycles and FCF margin > 20% for mature software platforms (ranges vary by sub-sector).
Net share count down over time without starving reinvestment.
Watch capex/sales and the trajectory, not just the level.
Pitfalls and false positives
“One-time” efficiencies that reverse (travel/T&E cuts, hiring freezes) masquerading as leverage.
Reclassifications (e.g., cost of revenue vs opex, capitalization policy changes) that boost margins artificially.
SBC ignored in per-share math; buybacks only offset dilution.
Over-extrapolating early-cycle margin gains into steady-state without acknowledging upcoming reinvestment (e.g., AI infrastructure cycles).
Ignoring working capital swings (deferred revenue timing, collections).
Checklist / one-pager
Map cost stack: fixed vs variable; identify the leverage points.
Compute DOL (1y and 3–5y).
Check ROIC – WACC spread and whether it’s widening.
Validate FCF conversion: CFO – capex vs net income; trend and stability.
Per-share: FCF/share CAGR and net share count path.
Capex/sales trend and utilization narrative (for cloud/AI).
Segment mix: who’s driving consolidation?
Build Base/Bull/Bear; attribute differences to pricing, mix, and cost scaling.
Audit accounting for reclassifications and SBC impact.
Glossary
Operating leverage: Sensitivity of operating income to changes in revenue.
DOL: Degree of operating leverage = %ΔOperating income ÷ %ΔRevenue.
ROIC: Return on invested capital = NOPAT ÷ invested capital.
WACC: Weighted average cost of capital; hurdle rate for value creation.
FCF conversion: How effectively accounting profits turn into free cash flow.
SBC: Stock-based compensation; can dilute shareholders.
RPO: Remaining performance obligations; proxy for booked, not yet recognized revenue.
Mid-cycle margins: Normalized margins across a cycle, excluding peaks/troughs.
Further reading
Microsoft Annual Report 2024 and FY24 Q4 performance pages (financials and segment detail) [as of Oct 18, 2024].
NYU Stern Cost of Capital datasets for context [as of Jan 2025].
Quality investing classics on ROIC and capital allocation; use primary filings to ground-check any secondary analysis.
References
Microsoft, Annual Report 2024 (incl. shareholder letter, financial review, buybacks/dividends tables), as of Oct 18, 2024: https://www.microsoft.com/investor/reports/ar24/index.html
Microsoft Investor Relations, FY24 Q4 Performance (growth across segments; YoY revenue increase context), as of July 2024: https://www.microsoft.com/en-us/investor/earnings/fy-2024-q4/performance
NYU Stern, Aswath Damodaran — Cost of Equity and Capital (US), sector datasets (Computer Software, etc.), as of January 2025: https://pages.stern.nyu.edu/~adamodar/New_Home_Page/datafile/wacc.html
Disclaimer
Educational content, not investment advice.