
How I evaluate every dividend stock (the 4-layer approach)
The difference between hoping and knowing

Yesterday I talked about the most expensive mistake dividend investors make: buying stocks without a repeatable process.
Today, let me show you what that process looks like.
After 13 years of analyzing companies and nearly a decade of teaching others how to do it, I’ve found that confident dividend analysis comes down to four layers:
Layer 1: Know what to look at.
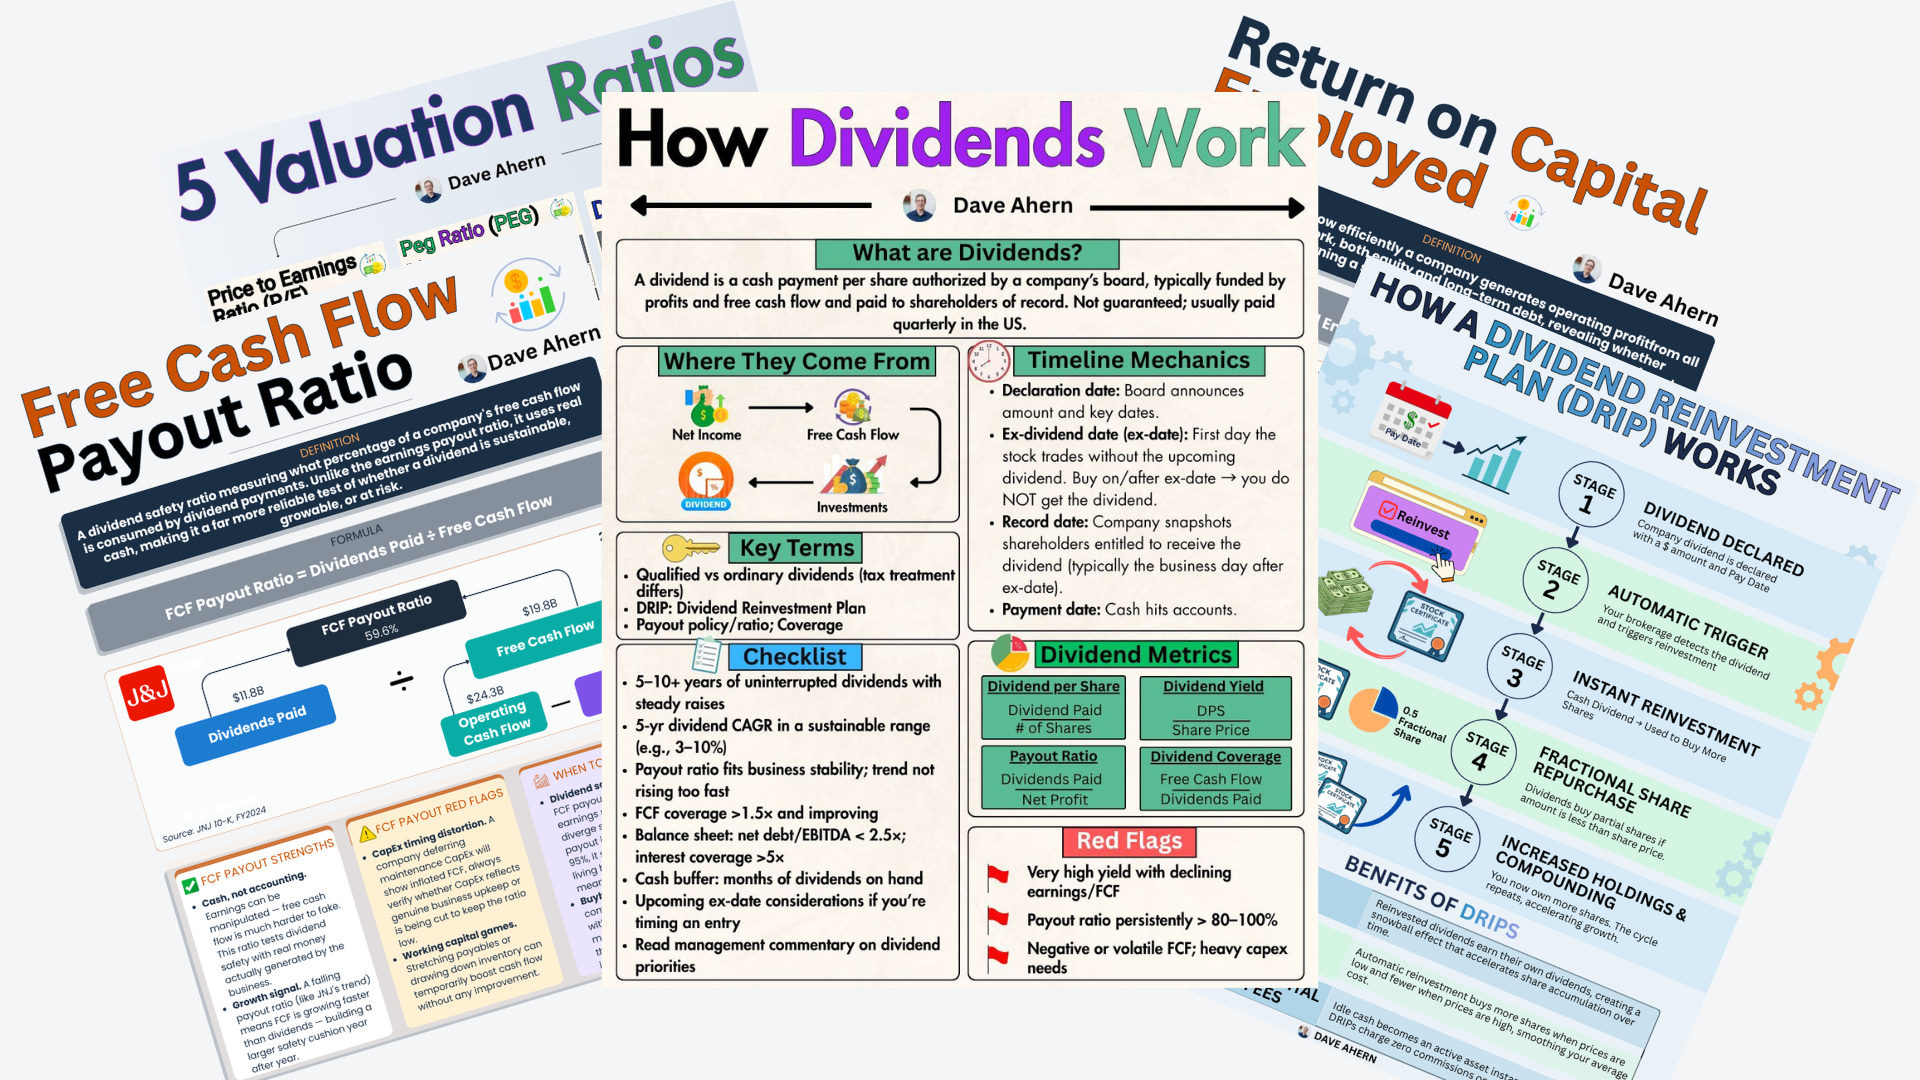
Before you touch a single number, you need to know which metrics matter for dividend stocks and what they’re telling you. Payout ratio, free cash flow yield, debt-to-equity, dividend growth rate, return on invested capital — these aren’t just vocabulary words. Each one answers a specific question about a company’s ability to pay, grow, and sustain its dividend.
Layer 2: Run the numbers yourself.
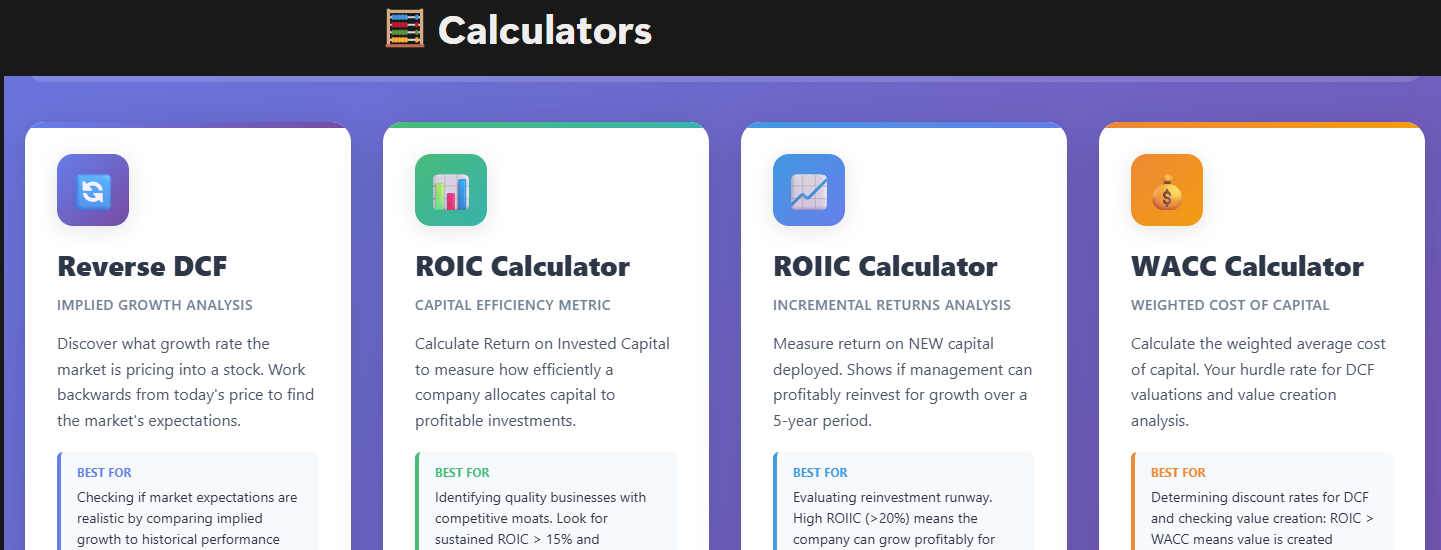
This is where most investors stall. They understand the concepts but don’t have a fast way to calculate them. So they skip it, or they rely on whatever number a screener spits out without understanding what’s behind it. You need tools that make the math frictionless so you can focus on what the numbers mean.
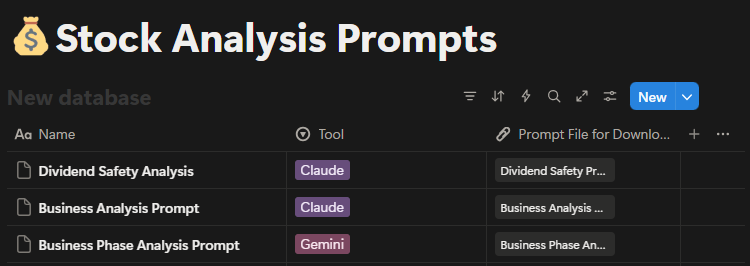
Layer 3: Stress-test your thesis.
Every stock looks good when you want to buy it. That’s confirmation bias at work. The third layer is deliberately poking holes in your own analysis. What would have to go wrong for this dividend to get cut? Is management allocating capital well? What’s the bear case — and does it hold up?
Layer 4: Practice on real companies.
You don’t learn to analyze stocks by reading about analyzing stocks. You learn by sitting down with a real 10-K, pulling real numbers, and building a real thesis. Then doing it again. And again. That’s how frameworks become instincts.
Most investing education stops at Layer 1. They teach you what payout ratios are. Maybe they show you a formula. Then they move on, leaving you to figure out the rest on your own.
That’s been the problem I’ve been trying to solve for the last several years. Not just teaching concepts, but building the actual resources that let someone sit down with a company and do the work. Visual references that make the concepts stick. Calculators that handle the math. Research frameworks that challenge your assumptions. Real company walkthroughs that show the process in action.
On Thursday, I’m going to show you what I’ve built. All four layers, in one place.
Dave
Keep up the great work!