
DuPont Analysis: The Formula That Reveals What Really Drives Returns
How to decode whether a company earns great returns through operational excellence, financial engineering, or both

Two companies can post identical ROE numbers yet operate with completely different risk profiles and business models. One might be a highly profitable business running lean. The other might be squeezing mediocre operations with dangerous levels of debt.
How do you tell the difference?
That’s where DuPont Analysis comes in. This century-old framework breaks ROE into its component parts, showing you exactly how a company generates returns for shareholders—and whether those returns are sustainable.
By the end of this article, you’ll understand how to decompose ROE into three drivers, spot the warning signs of leverage-dependent returns, and compare companies across different industries using a consistent framework.
The Problem With ROE Alone
Return on Equity is the standard measure of how effectively a company turns shareholder capital into profits. The basic formula is simple:
ROE = Net Income ÷ Shareholders’ Equity
A 20% ROE sounds attractive. But that single number hides crucial information. Consider two hypothetical companies:
Company A earns $20 million on $100 million in equity with minimal debt. Company B earns the same $20 million on the same $100 million in equity but carries $400 million in debt.
Both report 20% ROE. Only one is a ticking time bomb.
DuPont Analysis addresses this problem by decomposing ROE into the three levers management can use to generate shareholder returns.
The Three-Factor DuPont Formula
In the 1920s, the DuPont Corporation developed a framework to analyze the performance of its various divisions. The insight was elegantly simple: ROE can be mathematically decomposed into three distinct components, each measuring a different aspect of business performance.
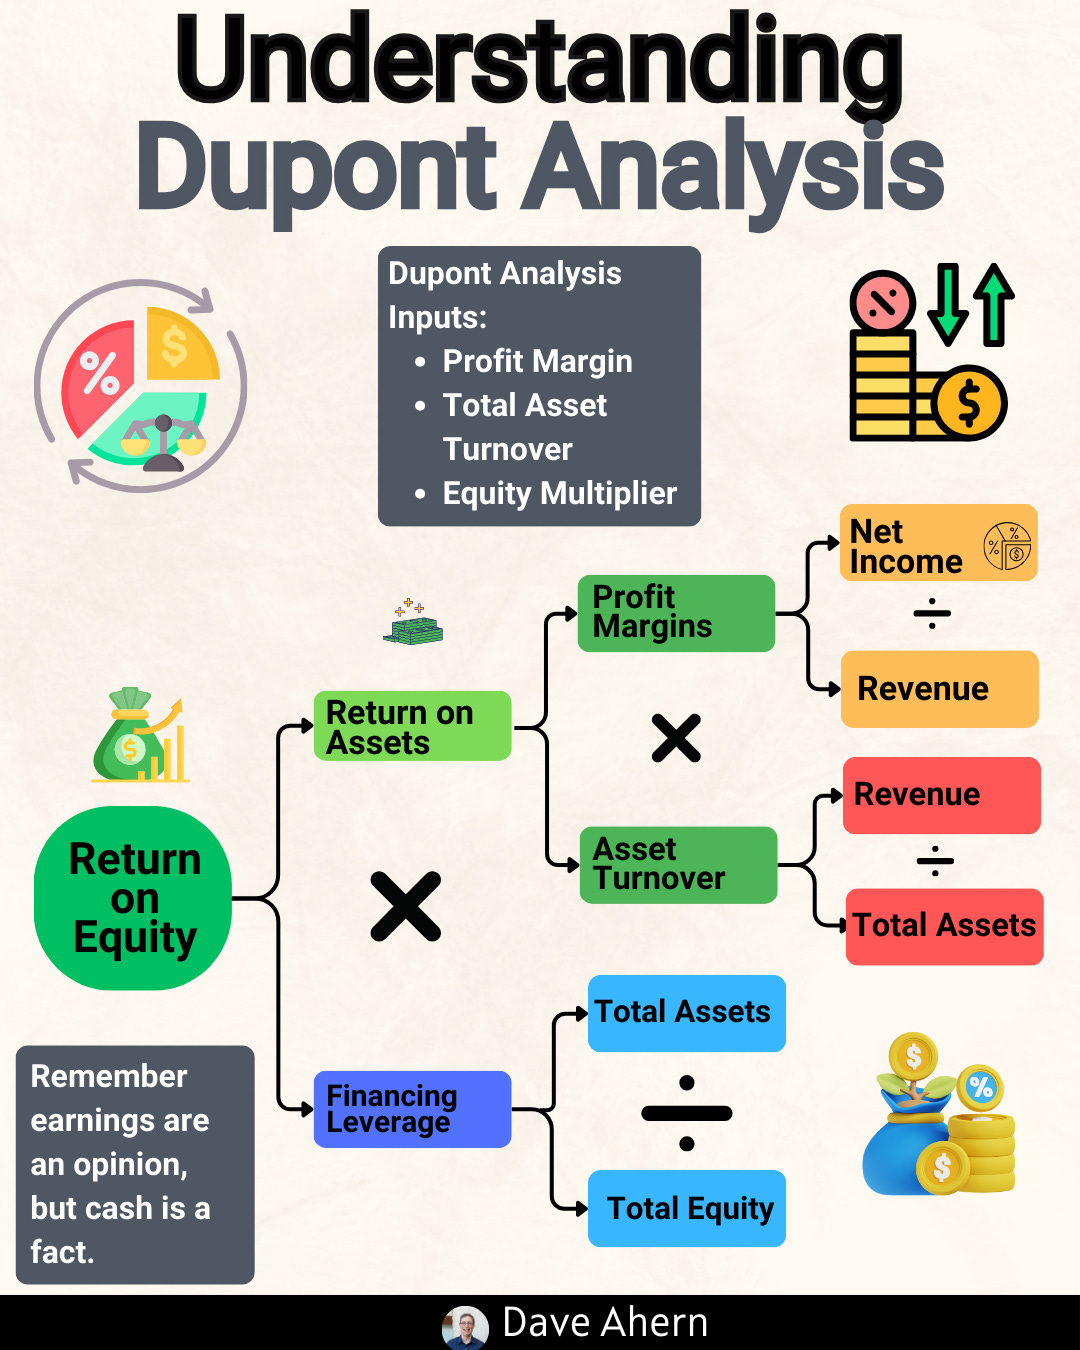
ROE = Net Profit Margin × Asset Turnover × Equity Multiplier
Let’s define each component:
Net Profit Margin measures profitability, how much of each revenue dollar the company keeps as profit after all expenses.
Net Profit Margin = Net Income ÷ Revenue
Asset Turnover measures efficiency, the extent to which a company uses its assets to generate revenue.
Asset Turnover = Revenue ÷ Total Assets
Equity Multiplier measures leverage, how much the company amplifies returns (and risk) through debt.
Equity Multiplier = Total Assets ÷ Shareholders’ Equity
When you multiply these three ratios together, the revenues and assets cancel out mathematically, leaving you with Net Income ÷ Shareholders’ Equity—the original ROE formula. But now you can see exactly where that return comes from.
Why This Decomposition Matters
Think of DuPont Analysis as an X-ray for corporate performance. Each component reveals something different:
Net Profit Margin indicates pricing power, cost control, and competitive moats. High-margin businesses typically have something special, a brand, a patent, network effects, or switching costs that let them charge premium prices or operate with unusual efficiency.
Asset Turnover indicates business model intensity. Asset-light businesses, such as software companies, might generate $2-3 in revenue for every dollar of assets. Asset-heavy businesses like retailers might generate $1- $2. Neither is inherently better; they’re just different operating models.
Equity Multiplier tells you about financial risk. An equity multiplier of 1.0 means zero debt. A multiplier of 2.0 means assets are split 50/50 between equity and debt. A multiplier of 5.0 means the company is 80% debt-financed. Higher leverage amplifies both gains and losses.
The key insight: sustainable, high-quality returns typically come from the first two factors, profitability and efficiency. Returns driven primarily by the third factor, leverage, are inherently riskier.
Now let’s put DuPont Analysis to work with three real companies: Alphabet (Google), Amazon, and Costco. Each generates solid returns through completely different paths—and understanding those differences will change how you evaluate any stock in your portfolio.
Paid subscribers get the complete breakdown below, including:
Step-by-step calculations using actual SEC filing data
Side-by-side comparison showing three different paths to strong returns
Red flags to watch for in each DuPont component
A practical checklist for applying this framework to any company
Upgrade to continue reading →
