
Dividend Growth vs. High Yield: What Actually Builds More Wealth?

“The best business to own is one that can employ large amounts of incremental capital over an extended period at very high rates of return.” — Warren Buffett, 1992 Berkshire Hathaway Shareholder Letter.
A 6% dividend yield looks a lot sexier than a 0.8% one. On paper, the choice seems obvious. You want income? Buy the stock that pays you six times more per dollar invested.
But here’s the thing.
That comparison only works if you freeze time at Year 1. The moment you let compounding do its work over 10, 15, or 20 years, the math tells a completely different story. And the story it tells is one Buffett has taught us for decades through investments like See’s Candies: businesses that reinvest at high rates of return, rather than paying out every dollar they earn, create far more wealth.
In today’s post, we will learn:
The core difference between dividend growth and high-yield strategies
The math behind compounding dividend growers (with a real model)
Why high-yield stocks often signal trouble, not opportunity
Real company examples showing both sides
How to identify the dividend growers worth owning
Two Philosophies, One Goal
Before we run the numbers, let’s define what we’re comparing.
Dividend Growth Investing focuses on companies paying a modest yield today (often 0.5% to 2.5%) but increasing that dividend at high rates every year. Think Visa, Microsoft, or Costco. These companies retain most of their earnings to reinvest in the business, and the dividend grows with earnings.
High-Yield Investing focuses on companies paying a large yield today (often 4% to 8%+). Think AT&T before its 2022 cut, or Altria. These companies distribute a large share of their earnings to shareholders because they have fewer high-return reinvestment opportunities.
Both strategies aim to generate income and total returns. But they get there through very different engines, and that difference matters enormously over time.
The key question is: would you rather have a big check today or a check that doubles every five to seven years?
The Math: Modeling Two Portfolios Over 20 Years
Let’s build two hypothetical portfolios, each starting with a $10,000 investment and reinvesting all dividends. The assumptions are designed to reflect realistic company profiles for each category.
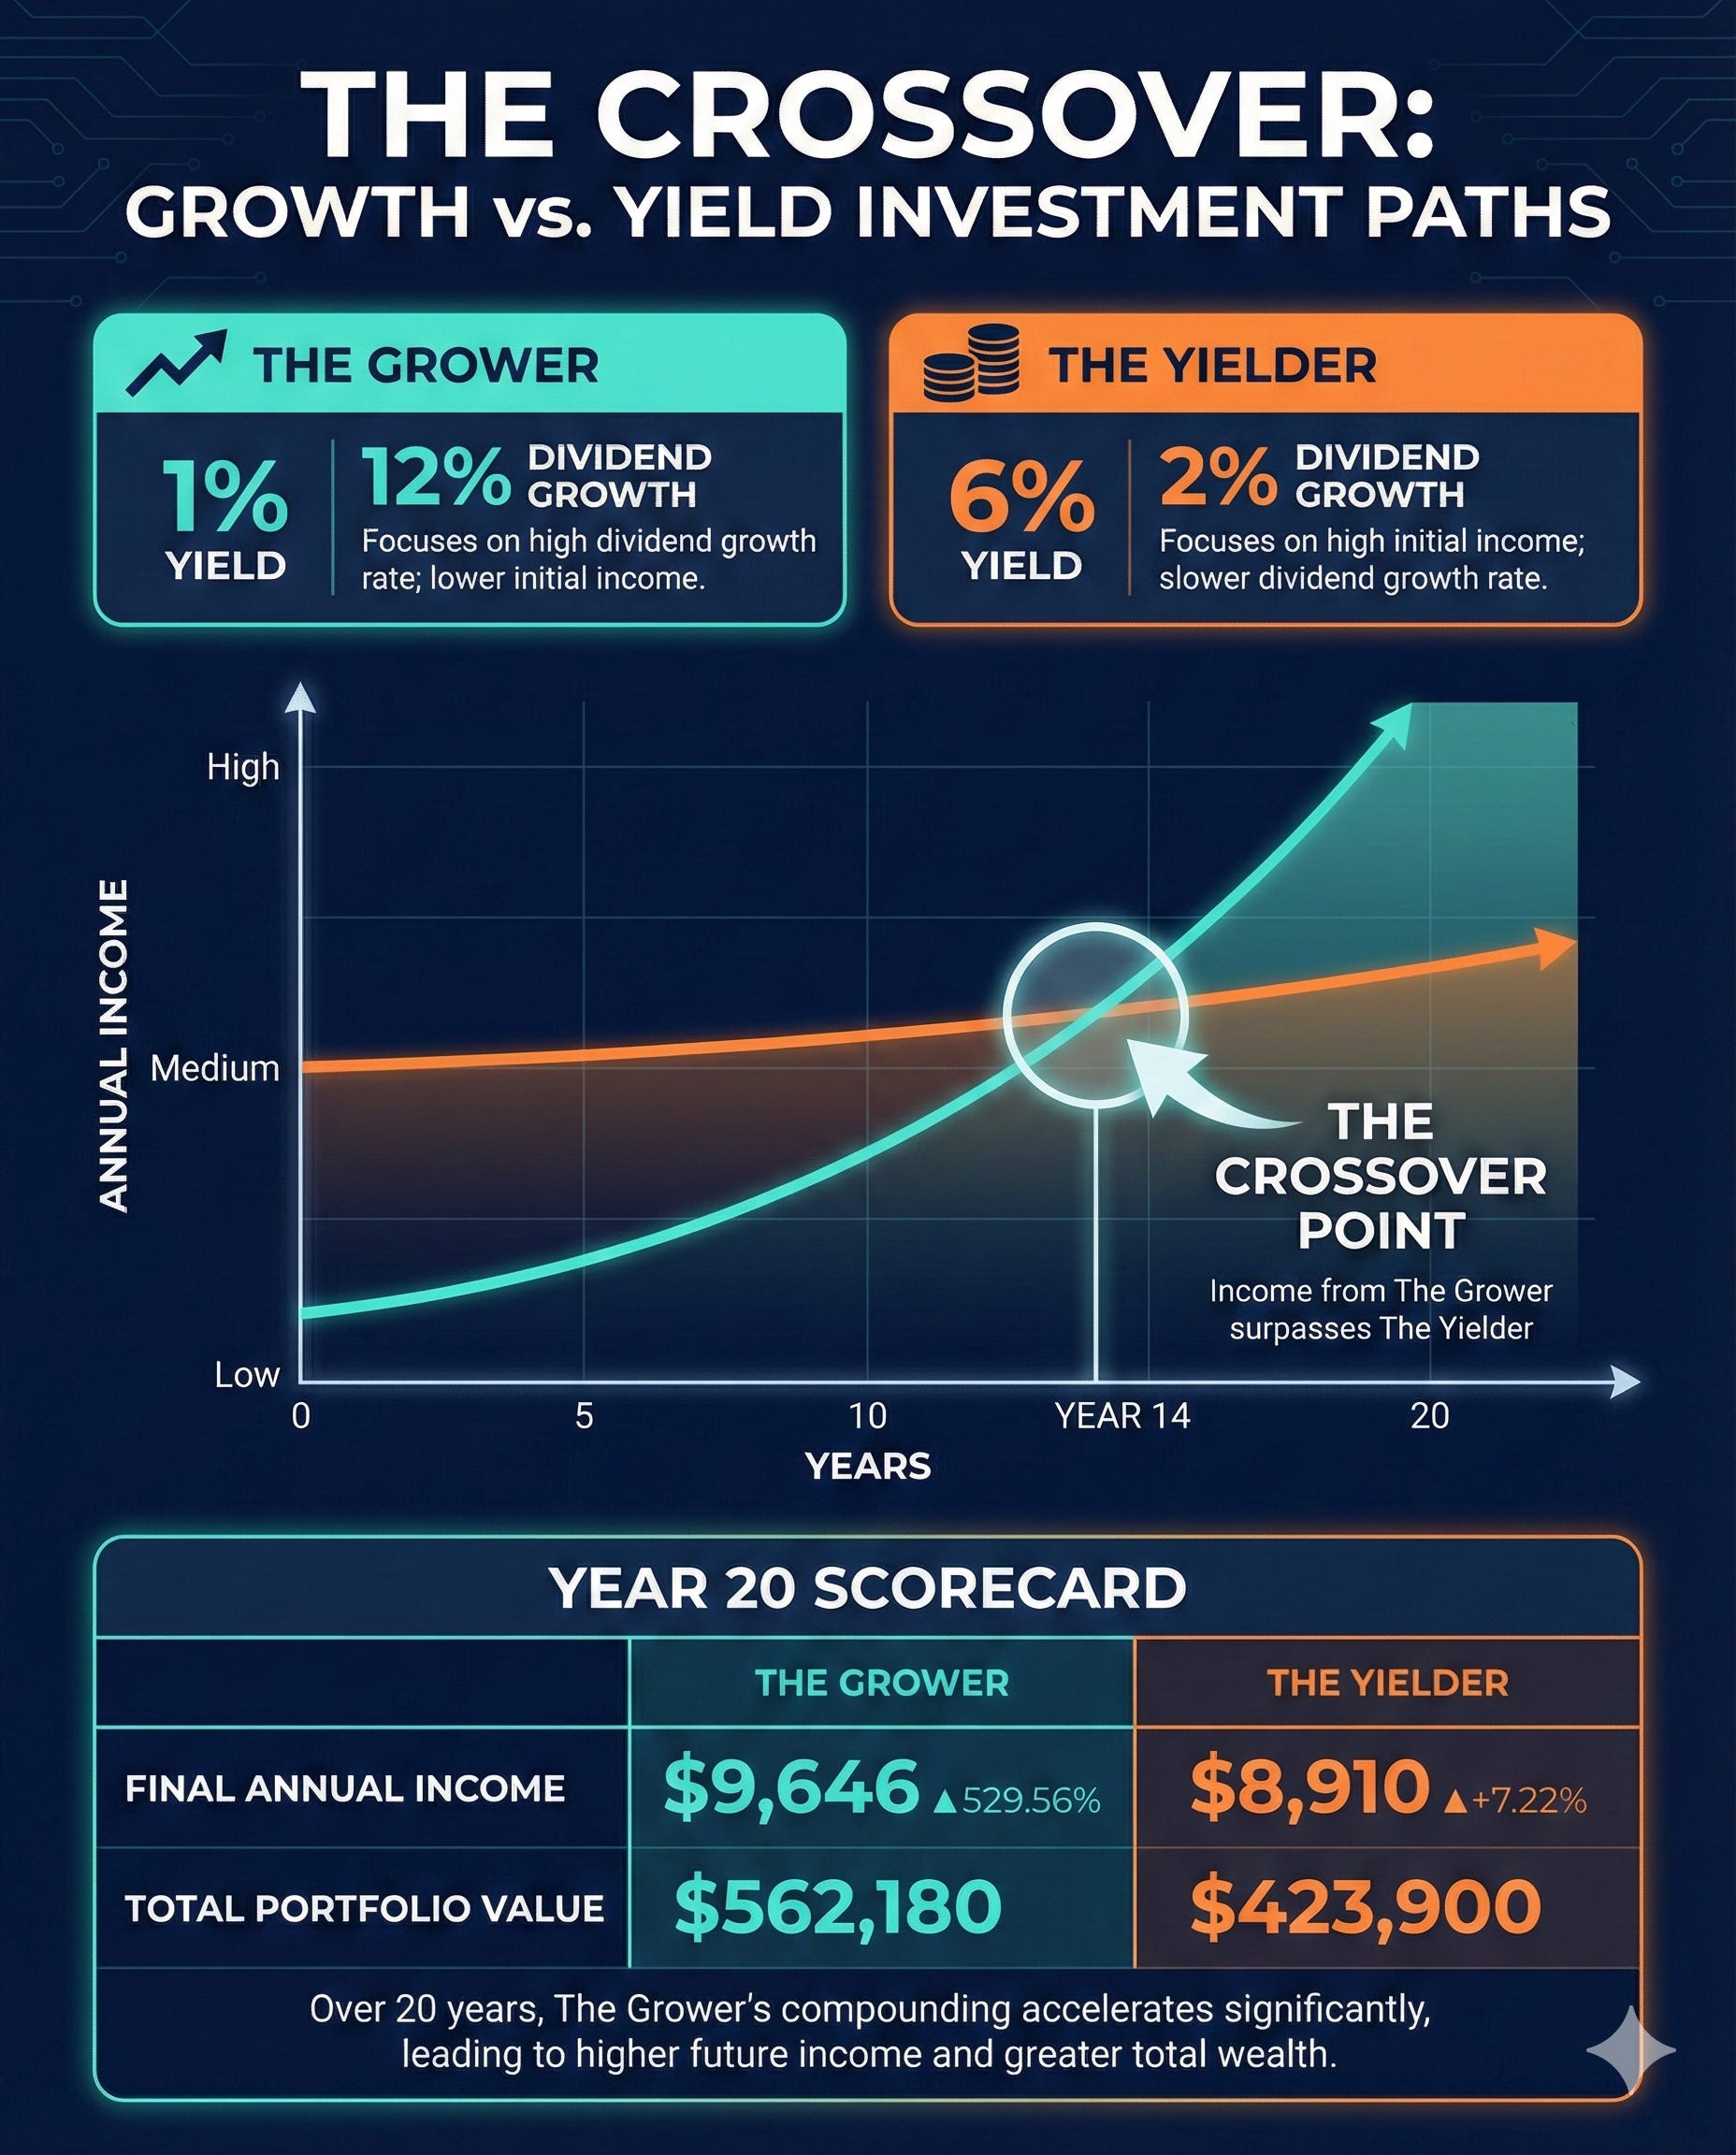
Portfolio A: “The Grower”
Starting dividend yield: 1.0%
Annual dividend growth rate: 12%
Annual share price appreciation: 10%
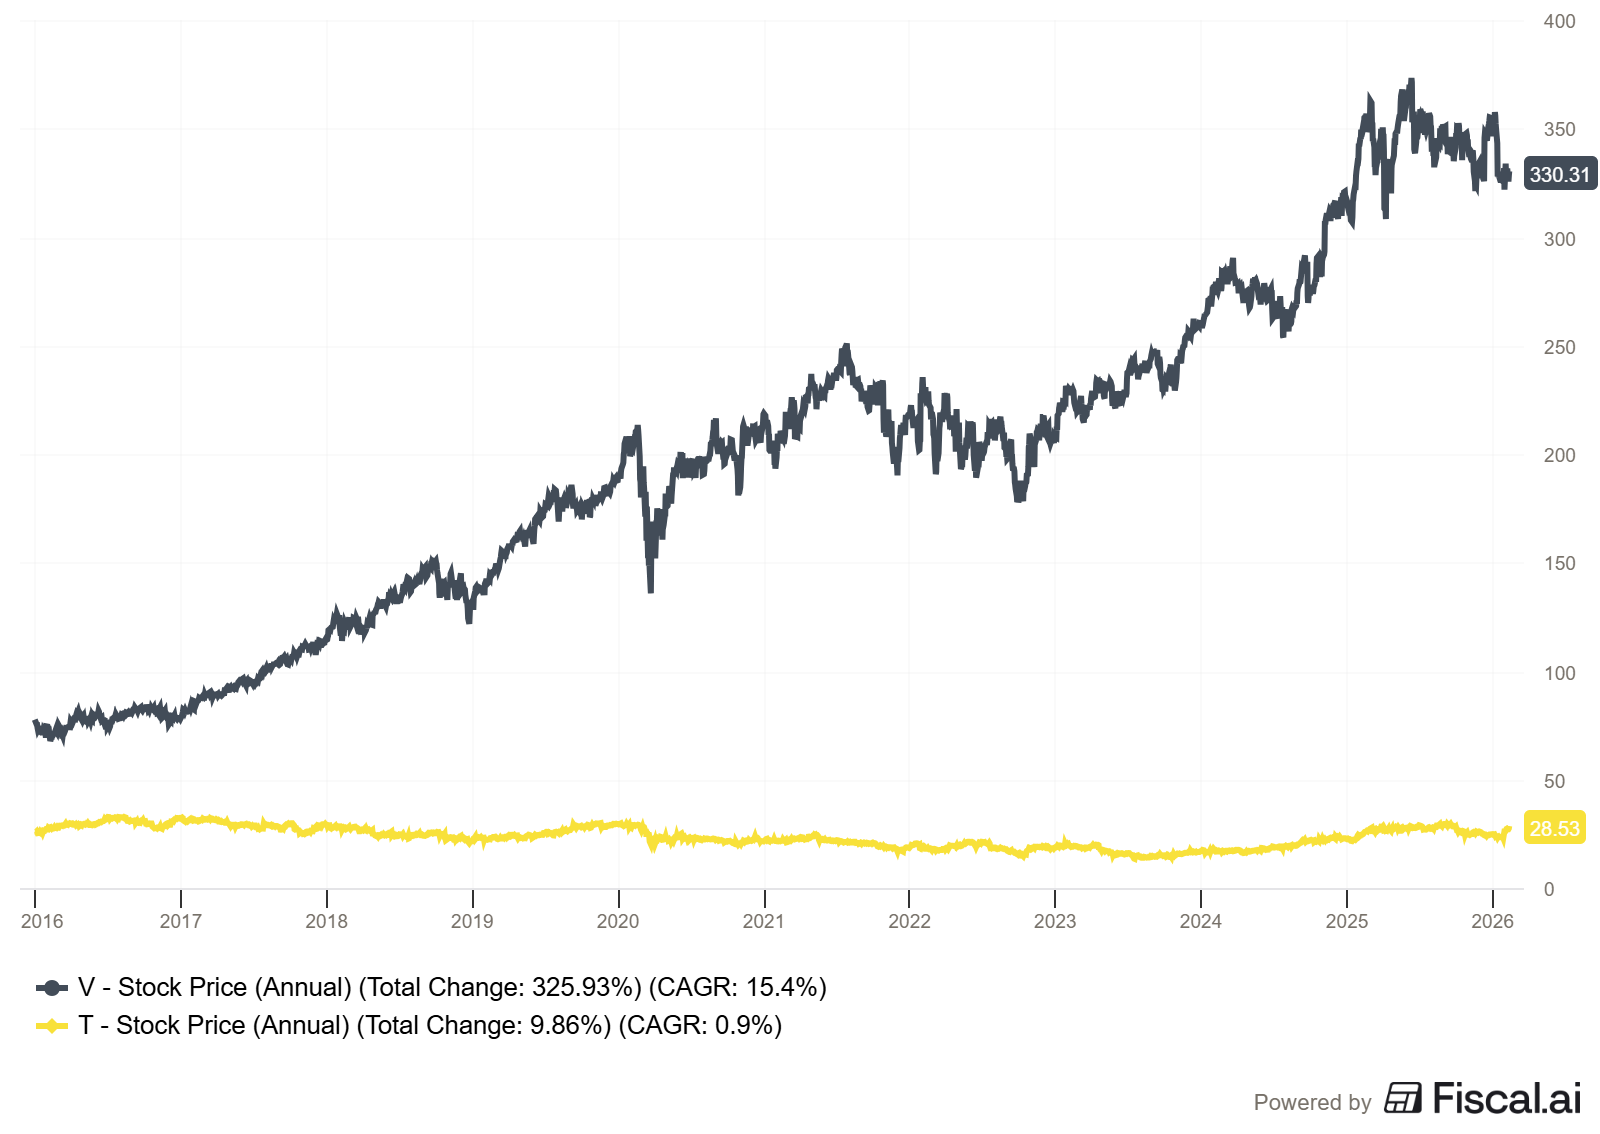
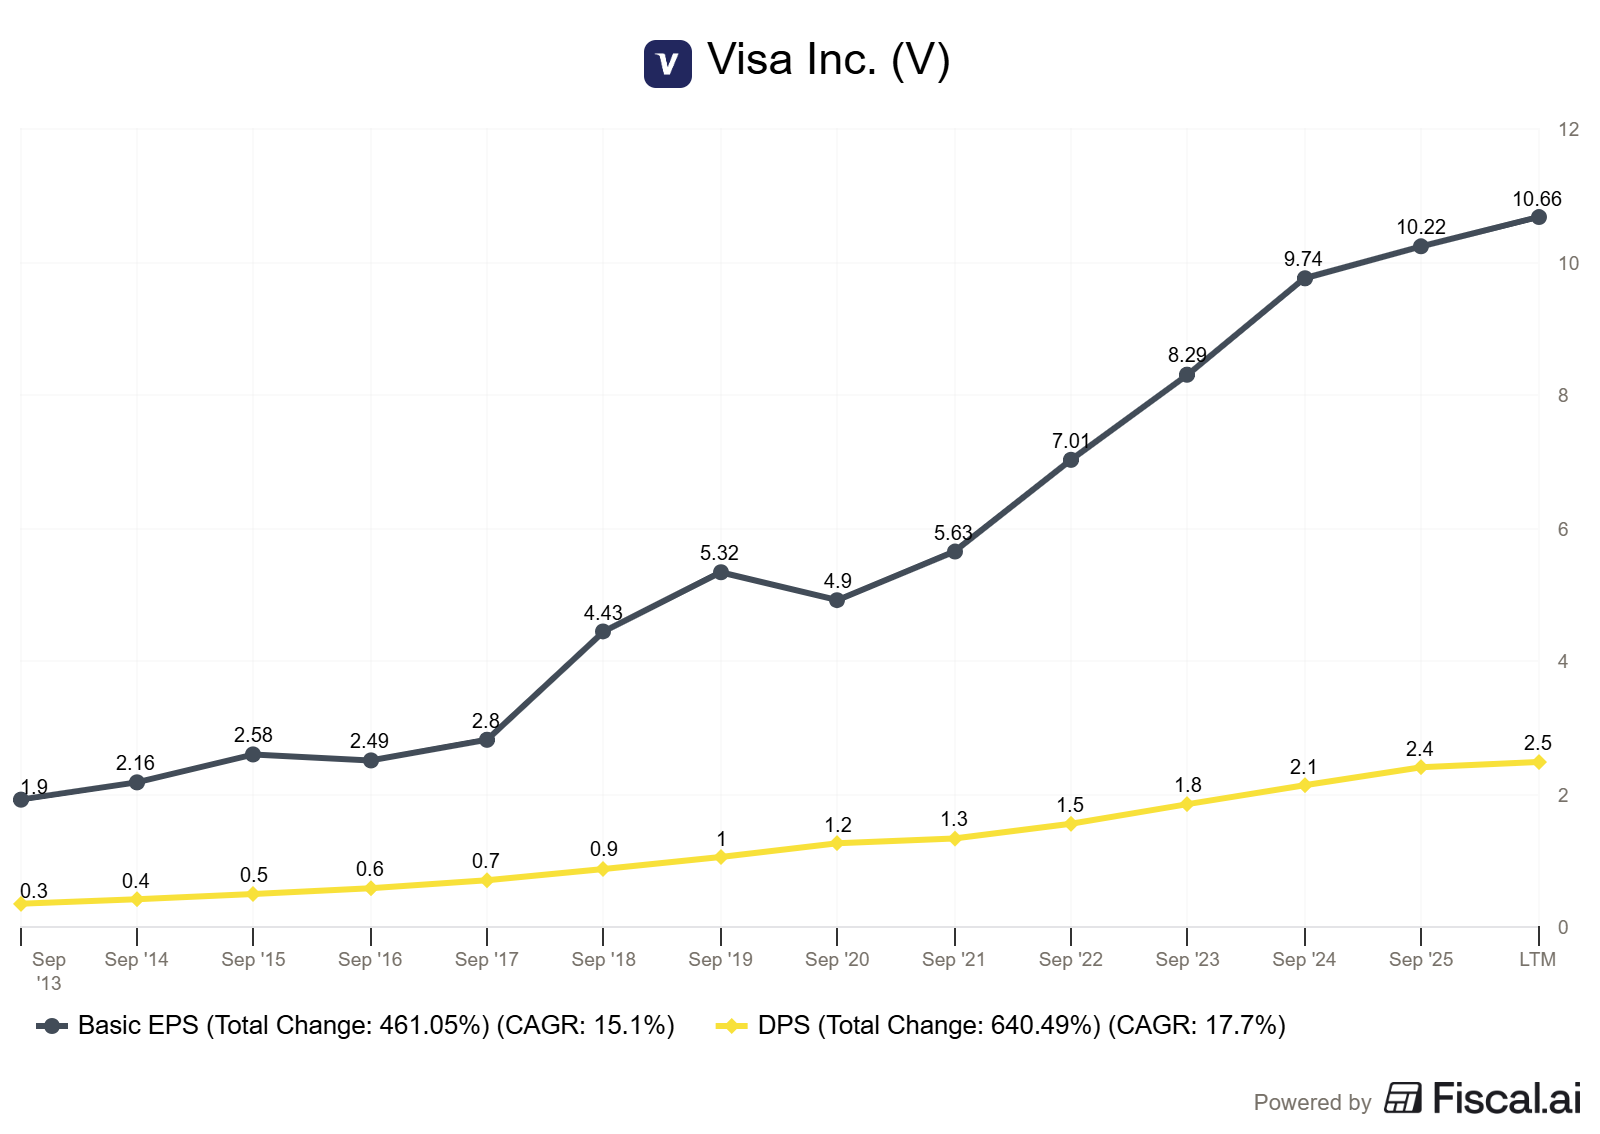
This mirrors a company like Visa, which currently yields around 0.8%, has grown its dividend at roughly 15%-17% annually over the past decade, and has delivered strong share price appreciation driven by its high ROIC and capital-light model.
Portfolio B: “The Yielder”
Starting dividend yield: 6.0%
Annual dividend growth rate: 2%
Annual share price appreciation: 3%
This mirrors a company like a pre-2022 AT&T or a mature utility, offering a fat yield with limited growth prospects and heavy capital requirements.
Here’s what happens with reinvested dividends:
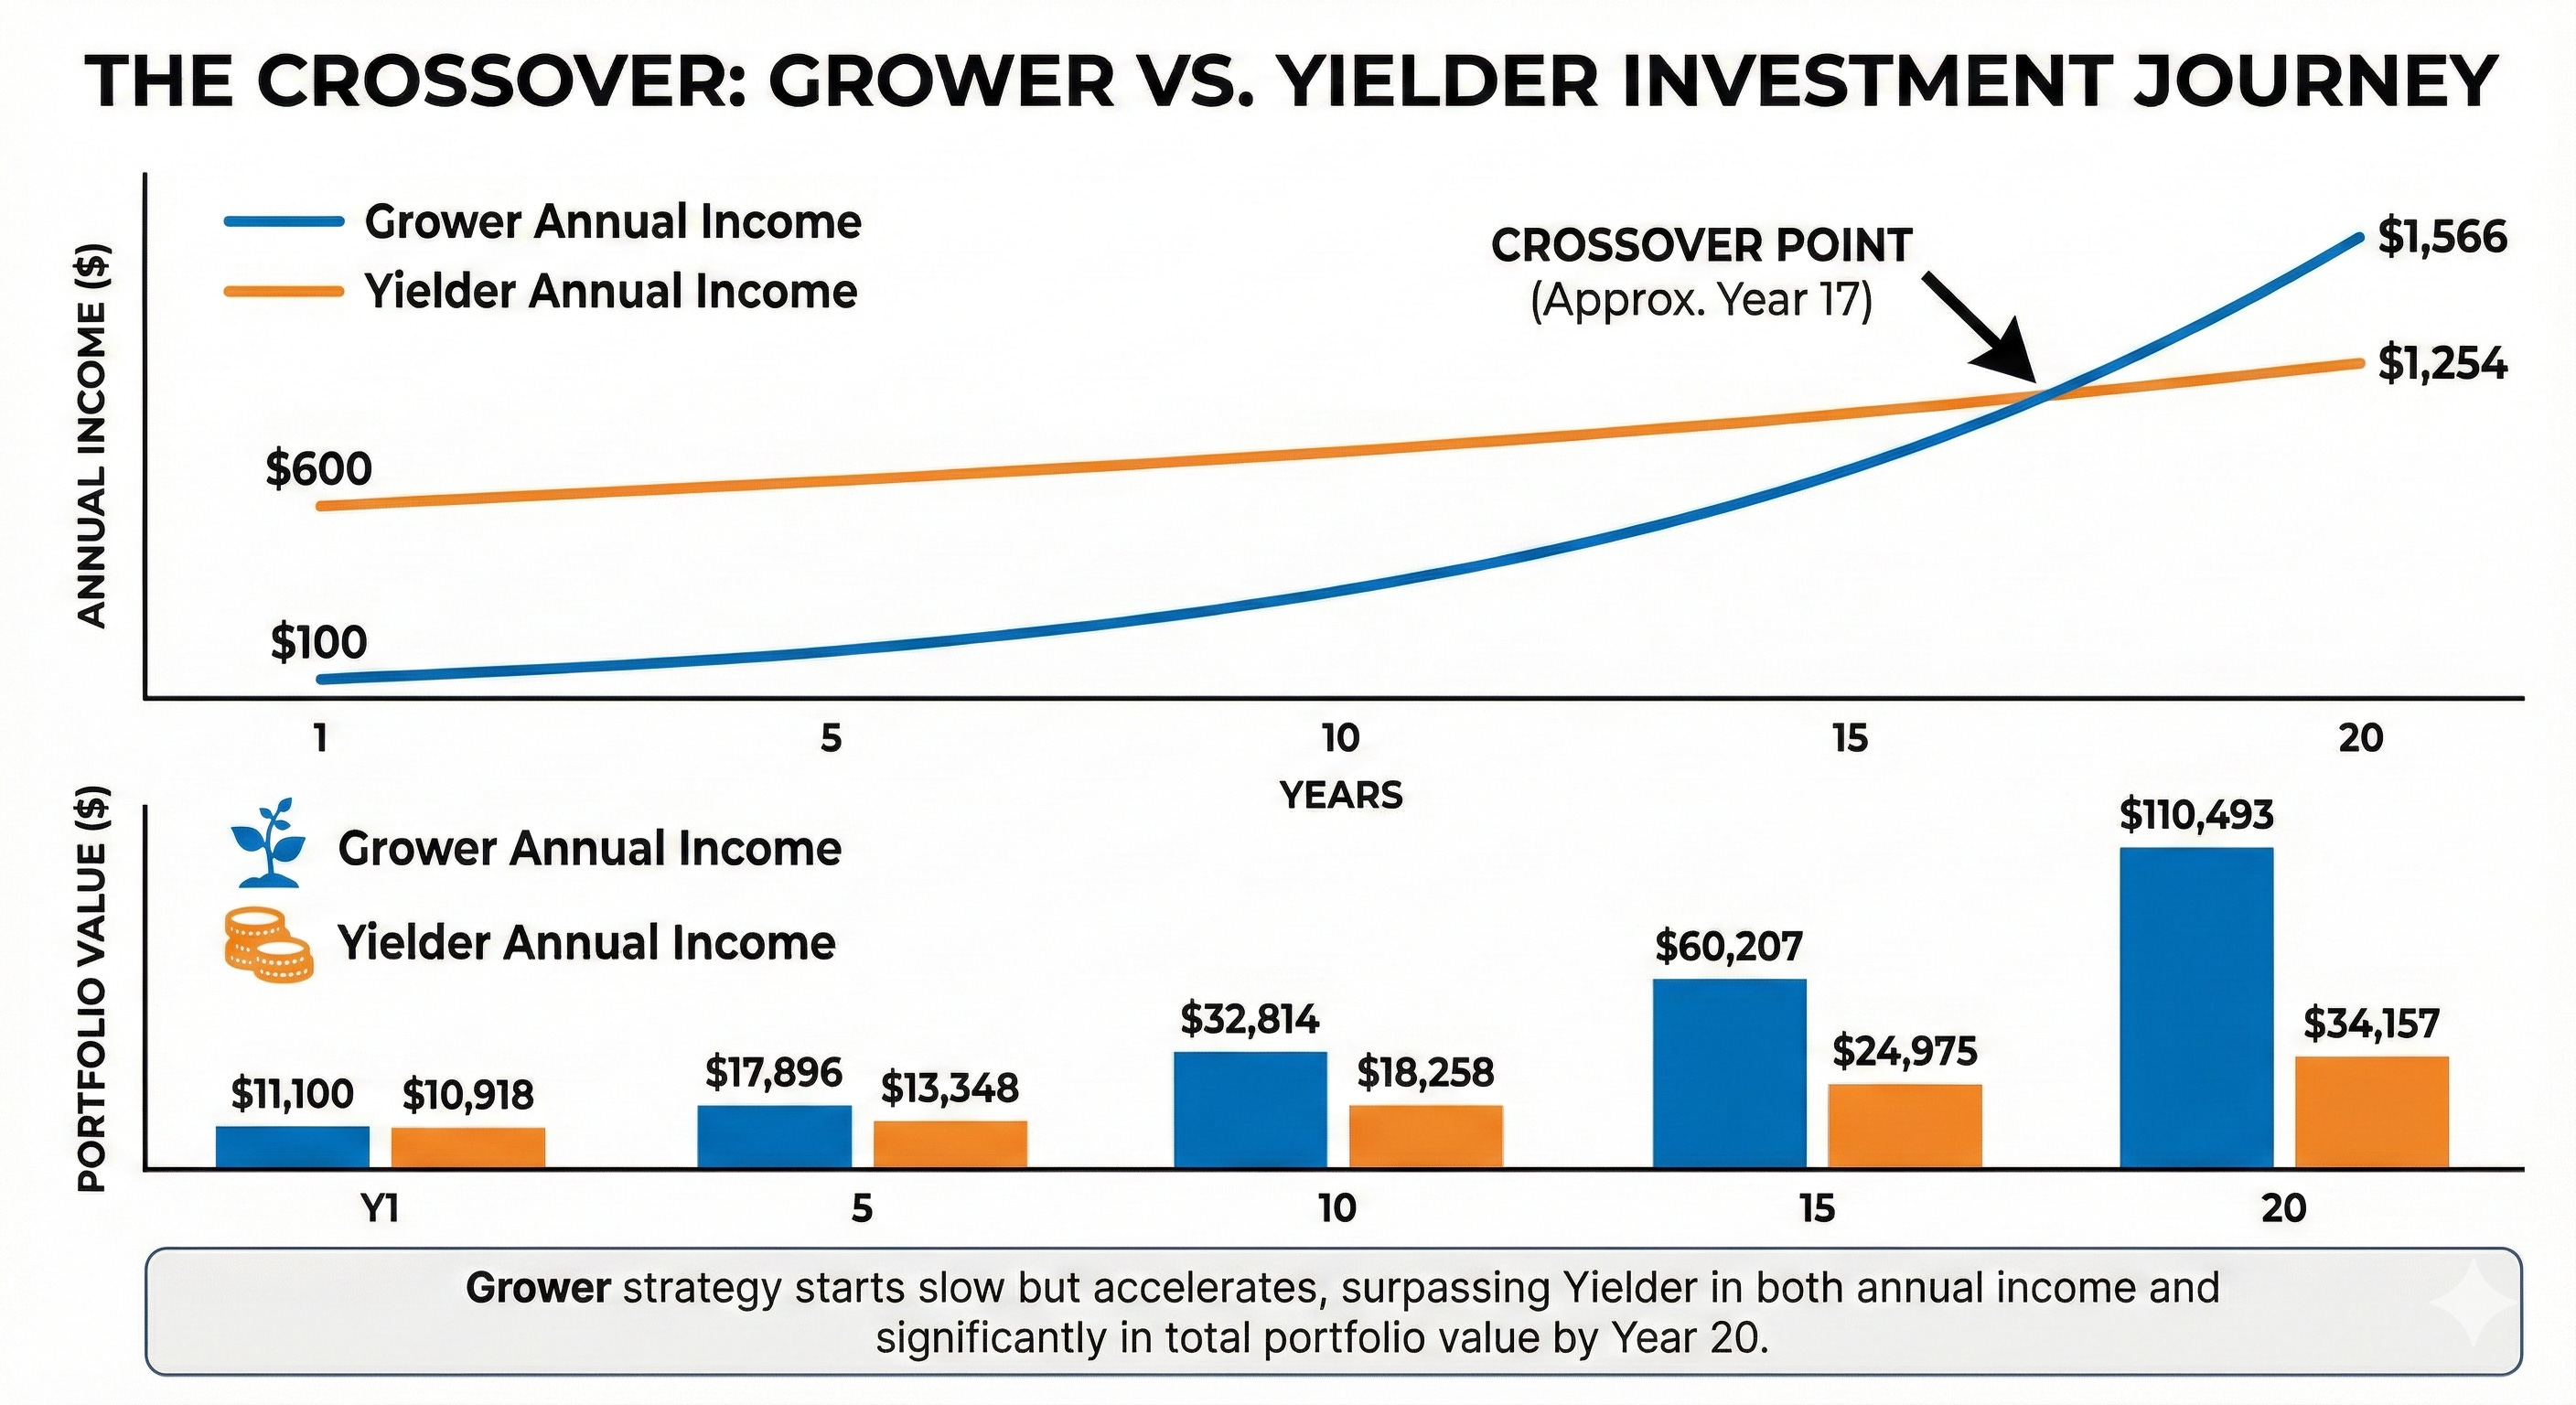
Look at Year 1. The Yielder is throwing off $600 in annual income versus the Grower’s $100. That’s a 6x advantage. It feels like no contest.
But by Year 10, the Grower’s annual income has nearly caught up to $384 versus $854. And by Year 15, the crossover starts to appear. By Year 20, the Grower is generating $1,566 in annual income compared to the Yielder’s $1,254.
More importantly, look at the total portfolio values. The Grower’s portfolio has compounded to over $110,000 while the Yielder sits at roughly $34,000. That’s a 3x difference in total wealth, and the gap only widens from here.
The crossover point for annual income typically occurs somewhere between Year 12 and Year 16, depending on the exact growth rates. But the crossover for total wealth? That happens much sooner, often by Year 5 or 6.
This is the power of what I call the “dividend growth engine.” It’s the same principle Buffett saw in See’s Candies. See’s didn’t pay out everything. It retained earnings and generated ever-higher profits from a small capital base, which Buffett then redeployed into other investments. The compounding machine wasn’t the dividend. It was the growth of the earning power behind the dividend.
Why High Yields Often Signal Danger
A high yield isn’t always a gift. Sometimes it’s a warning.
Dividend yield is a fraction. Yield equals the annual dividend divided by the share price. A yield can become “high” in two ways: the company raises its dividend (good), or the share price falls (bad). Many high-yield stocks carry elevated yields because the market is pricing in trouble.
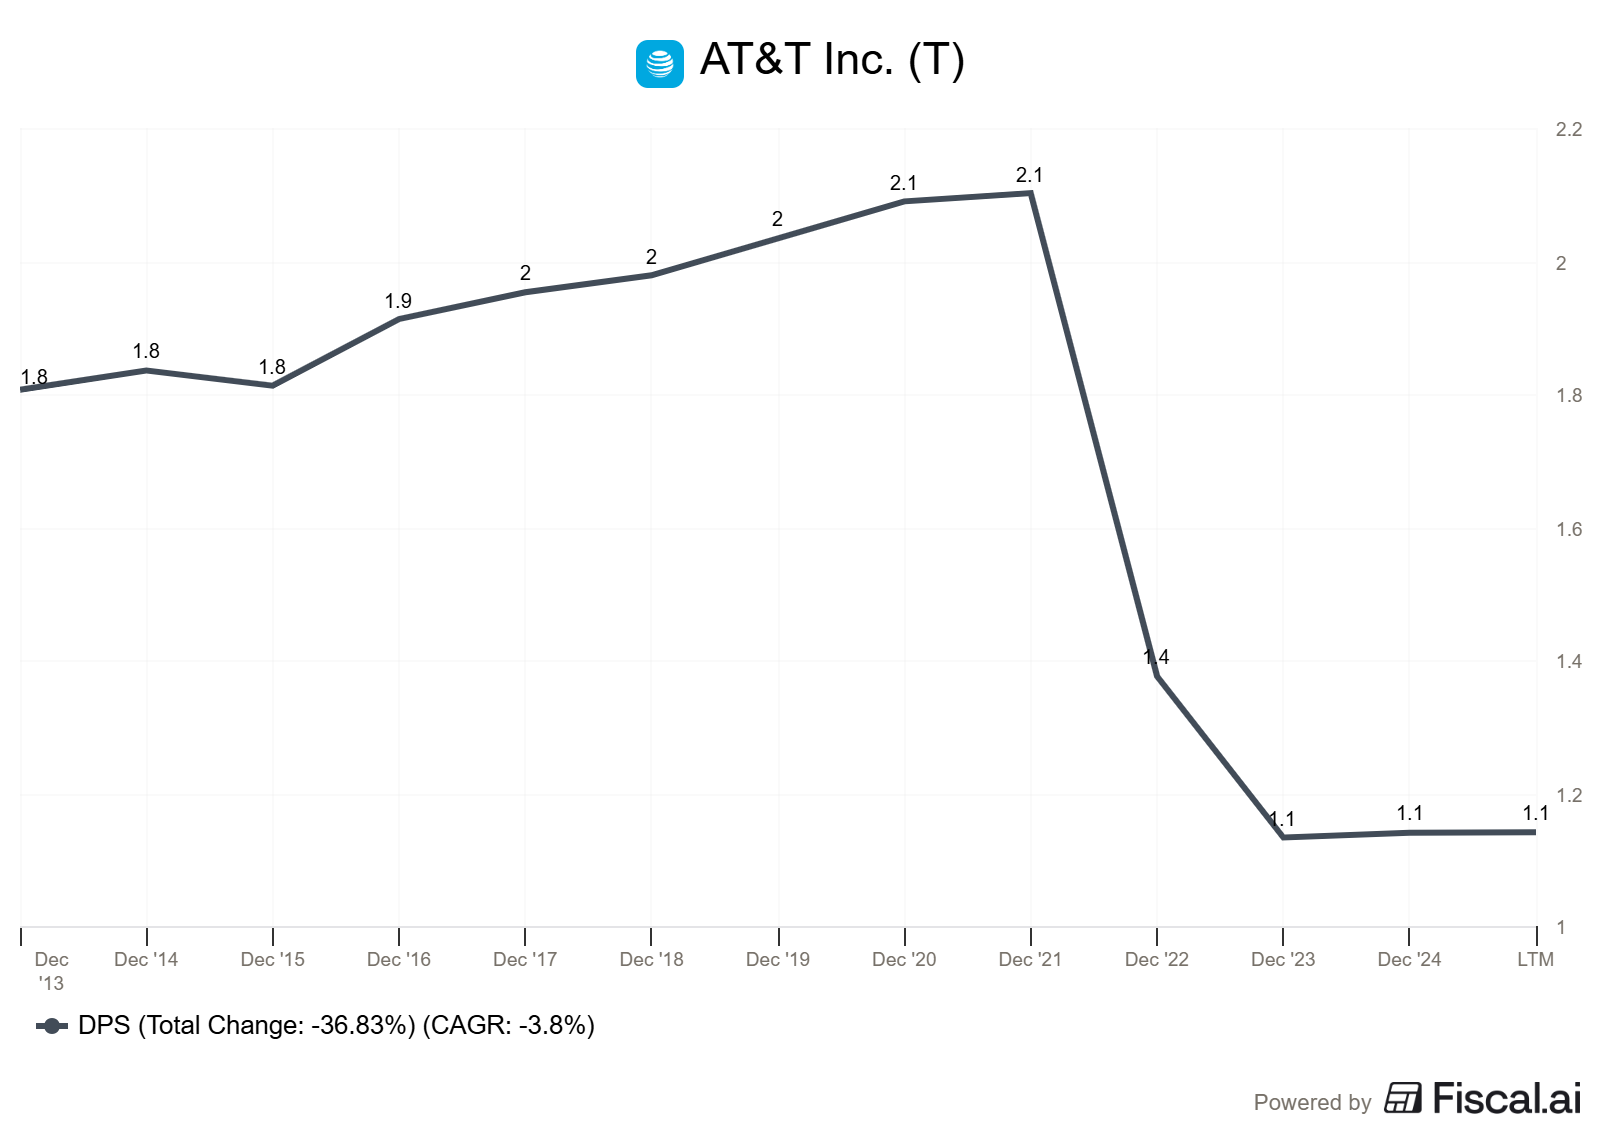
AT&T is the poster child for this lesson. For years, AT&T offered yields north of 7%, attracting income-hungry investors. But the company carried over $150 billion in debt (per AT&T’s fiscal year 2021 10-K), had limited growth prospects, and was struggling to maintain its payout. In 2022, AT&T cut its dividend by roughly 47% after spinning off its media business. Investors who bought for the yield got a painful lesson in sustainability.
The warning signs were visible for years. AT&T’s payout ratio had ballooned above 60%, free cash flow barely covered the dividend, and the company’s ROIC was mediocre at best. As Buffett would categorize it, AT&T was a “Category 3” business: one that requires significant capital to grow but generates low returns on that capital.
Compare that to Visa. According to recent data, Visa’s payout ratio is approximately 23%. The company retains nearly 77 cents of every dollar it earns and reinvests it at returns on invested capital north of 30%. That retained capital fuels earnings growth, which in turn fuels dividend growth, until it eventually overtakes the high-yielder.
When evaluating any dividend stock, the payout ratio tells you how sustainable the dividend is and how much room the company has to grow it. A payout ratio under 50% with a strong ROIC gives you confidence that the dividend will keep climbing. A payout ratio above 70% with stagnant or declining earnings is a flashing yellow light.
Real Company Case Studies: The Numbers Don’t Lie
Let’s move beyond hypotheticals and look at actual companies. I want to compare two real businesses to show how these dynamics play out in practice.
Visa (V): The Dividend Growth Machine
Visa is the ideal dividend-growth investment. Here’s what makes it special, drawn from its SEC filings and publicly available data:
Current dividend yield: approximately 0.8%
10-year dividend growth rate (CAGR): approximately 17% per year
Consecutive years of dividend increases: 17
Payout ratio: approximately 23%
ROIC: consistently above 30%
Visa has grown its dividend at a pace that doubles it roughly every 4 to 5 years. An investor who bought Visa ten years ago at a yield of roughly 0.7% is now earning a yield on cost (the dividend relative to their original purchase price) that far exceeds what most high-yield stocks offer today.
This is possible because Visa is a capital-light business. It doesn’t manufacture anything. It doesn’t carry inventory. It operates a payment network that processes trillions of dollars in transactions annually and takes a small fee on each one. As discussed in our earlier piece on how payment processing works, the credit card network sits at the center of every transaction, earning fees on volume without requiring significant capital.
That capital efficiency is the engine. Low capital requirements imply a high ROIC, enabling the company to grow earnings rapidly while still increasing its dividend by double digits each year.
AT&T (T): The Yield Trap
AT&T tells the opposite story. For decades, AT&T attracted income investors with yields between 5% and 7%. But the underlying business couldn’t support that generosity forever.
According to AT&T’s fiscal year 2022 10-K, the company carried total debt of approximately $154.7 billion (including $7.6 billion in short-term debt, $128.4 billion in long-term debt, and $18.7 billion in leases). Interest expense for fiscal year 2022 was $6.1 billion, money that goes to creditors before shareholders see a dime.
AT&T’s debt burden, combined with massive capital expenditure requirements for 5G and fiber buildouts, left little room for error. When the company spun off its media assets in 2022, it slashed the annual dividend from $2.08 per share to $1.11. Investors who had been collecting that fat yield suddenly saw their income cut nearly in half.
The lesson: AT&T was using Buffett’s “Category 3” playbook. It required enormous capital to operate (billions in annual capex), generated modest returns on that capital, and funded its dividend partly through debt. That’s not a sustainable combination.
Today, AT&T yields roughly 4% with a more sustainable payout ratio. It may be a fine income investment going forward. But investors who bought a decade ago for the high yield have underperformed the S&P 500 on a total return basis by a wide margin.
Five Metrics to Identify Elite Dividend Growers
Not every low-yield stock is a future compounder. You need a framework to separate the real growers from the pretenders. Here are the five metrics I look for:
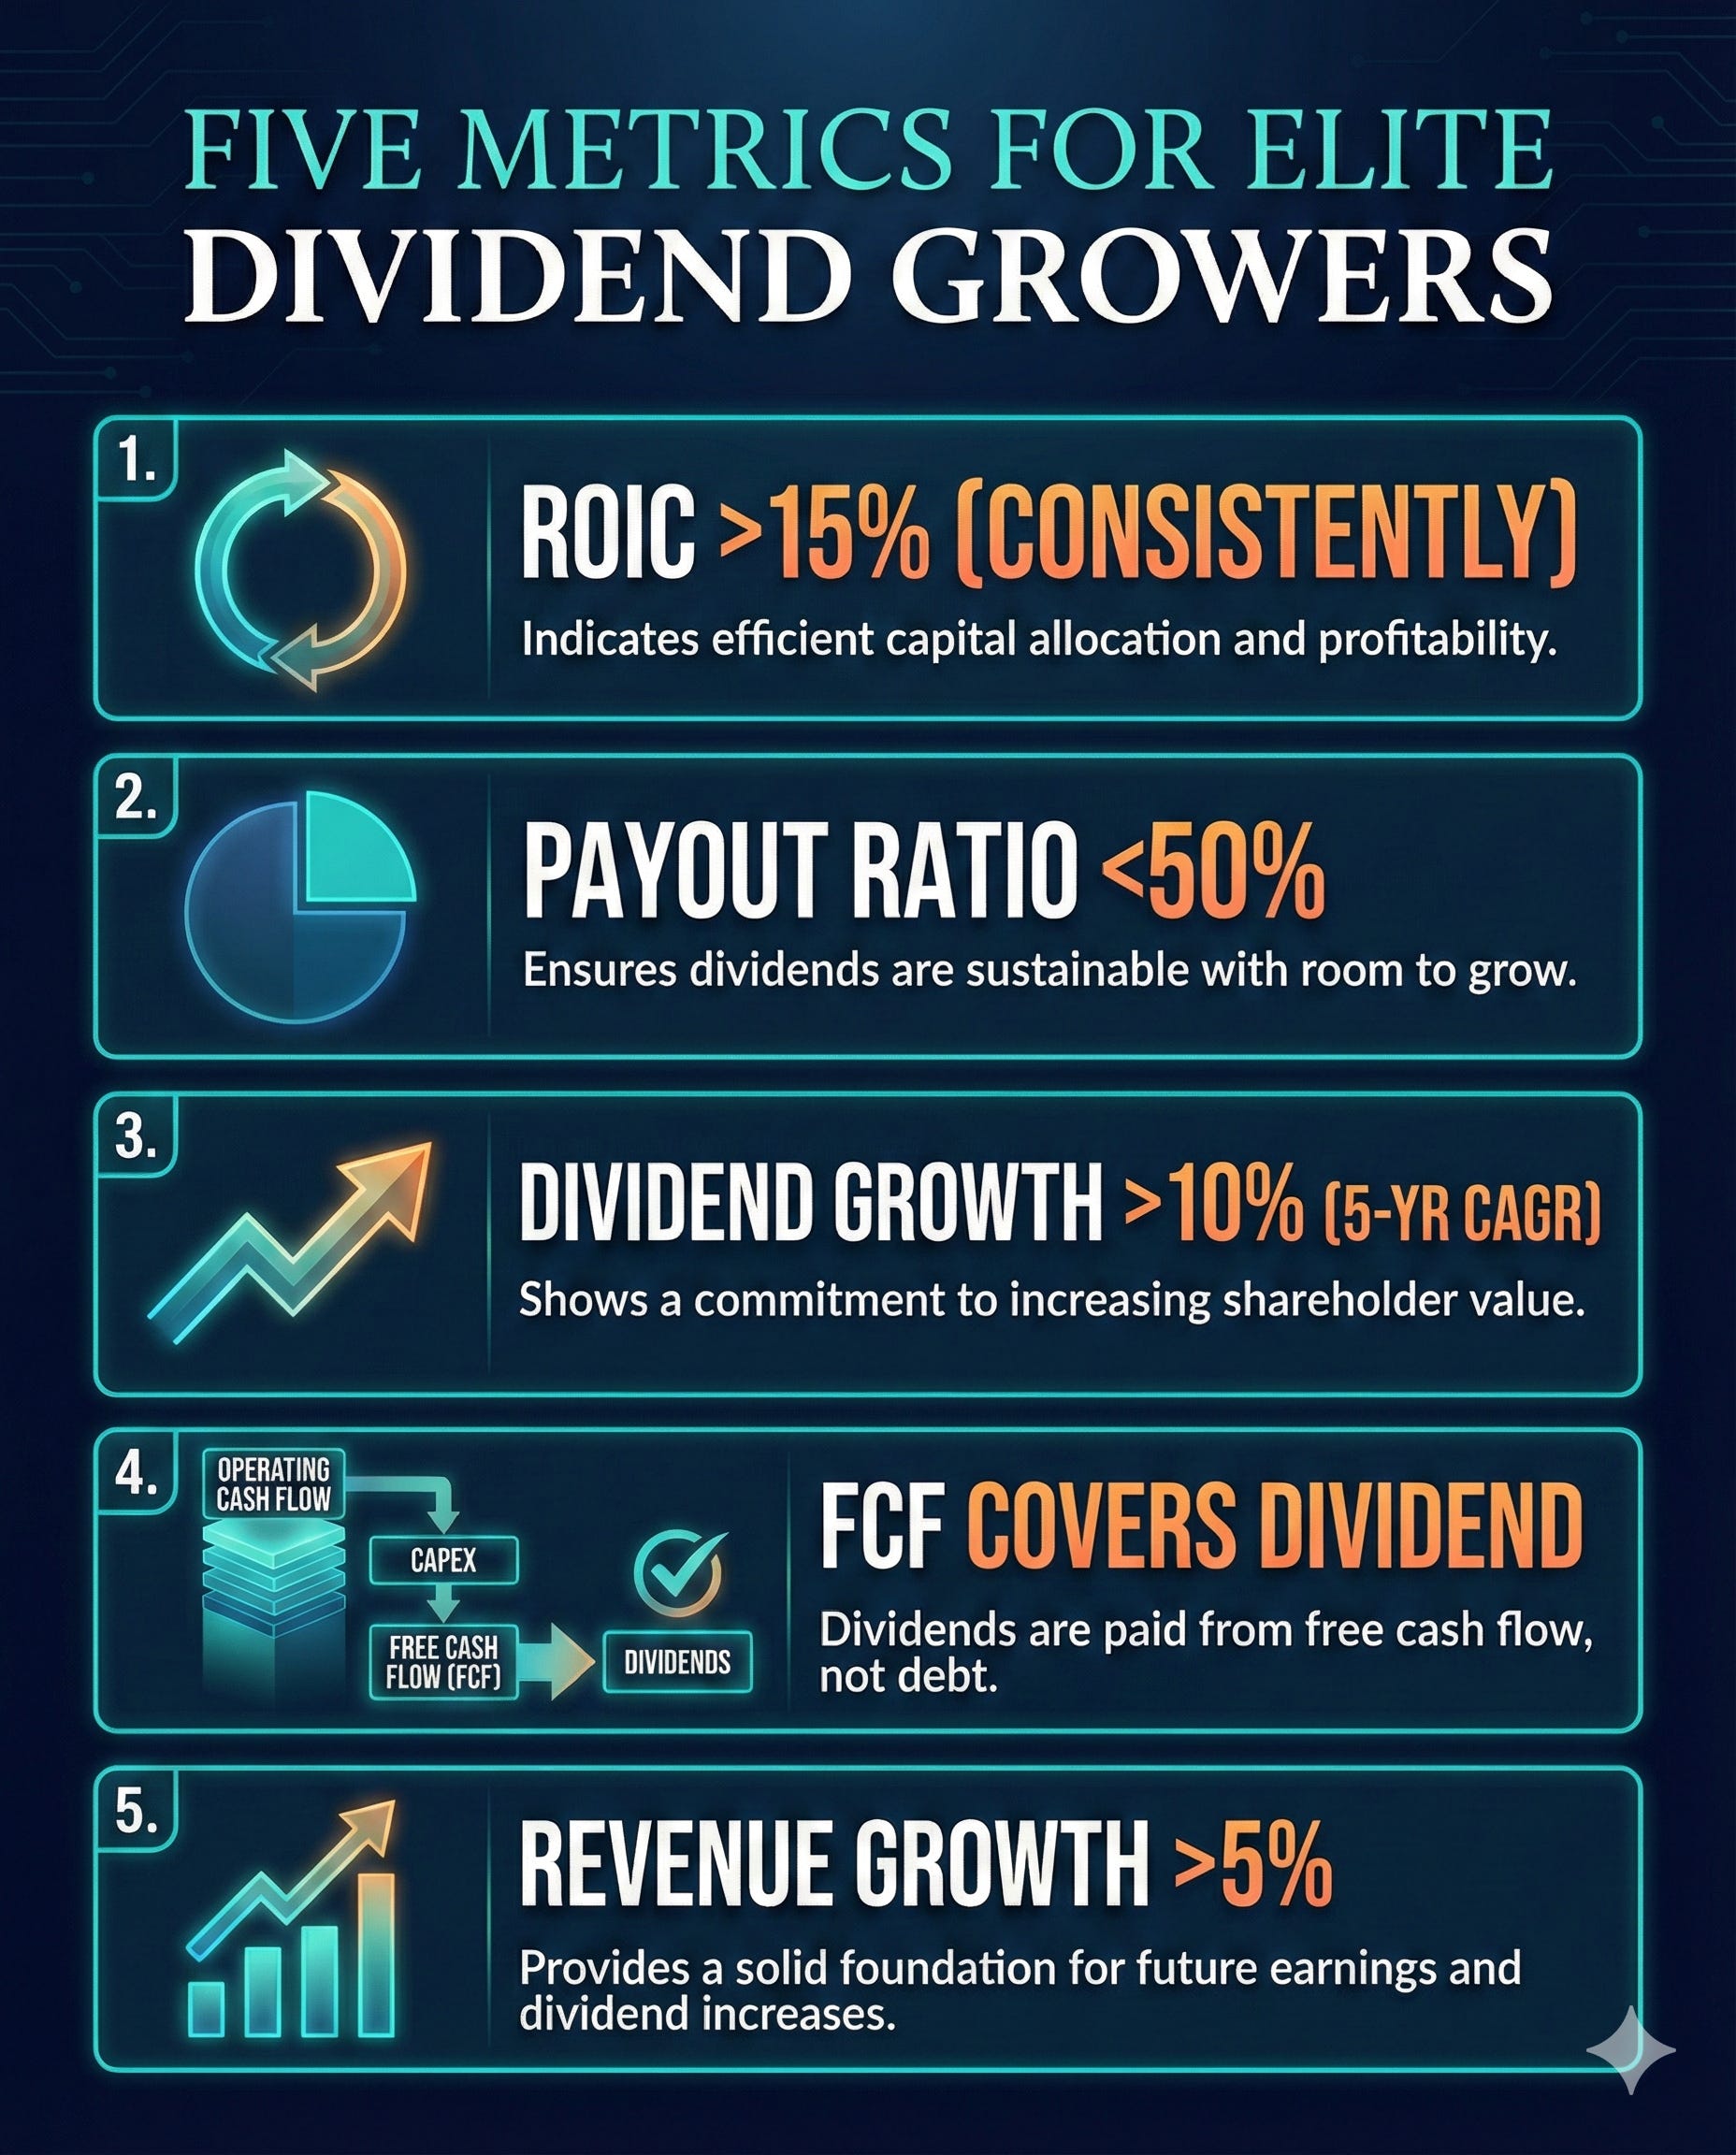
1. ROIC Above 15% (Consistently)
Return on invested capital measures how efficiently a company converts its invested capital into profits. A company with a ROIC above 25%, such as Visa or Microsoft, has a fundamentally different economic engine than one with an 8% ROIC. A high ROIC means the company creates more value per dollar retained, which directly fuels dividend growth.
Look for consistency here. A single year of high ROIC can be a fluke. Five to ten years of sustained ROIC above 15% signals a real competitive advantage.
2. Payout Ratio Below 50%
A low payout ratio indicates the company is retaining most of its earnings for reinvestment. This gives the dividend two benefits: safety (there’s a buffer if earnings dip temporarily) and growth potential (retained earnings fuel future profit growth).
Visa’s payout ratio of roughly 23% means the company could double its dividend tomorrow and still retain half its earnings. That’s an enormous runway.
3. Dividend Growth Rate Above 10% (5-Year CAGR)
The growth rate of the dividend tells you how quickly your income stream is compounding. At 10% growth, your dividend doubles every 7.2 years. At 15% growth, it doubles every 4.8 years. At 20% growth, it doubles every 3.6 years.
Look at the 5-year compound annual growth rate to smooth out any one-year anomalies. Companies such as Visa (approximately 15% CAGR), Microsoft (approximately 10% CAGR), and Costco (approximately 10% CAGR) have demonstrated sustained double-digit dividend growth.
4. Free Cash Flow Comfortably Covers the Dividend
Earnings can be manipulated through accounting choices. Free cash flow is harder to fake. The dividend should be well-covered by free cash flow, not just reported earnings. I want to see the free cash flow payout ratio (dividends paid divided by free cash flow) below 40% for the strongest growers.
This confirms that the company generates real cash to fund the dividend and still has ample capacity for reinvestment, acquisitions, or buybacks.
5. Revenue Growth of at Least 5% Annually
Dividend growth ultimately comes from earnings growth, and earnings growth comes from revenue growth (combined with margin expansion or share buybacks). A company with stagnant revenue will eventually hit a ceiling on how fast it can grow its dividend.
Look for companies with a clear path to continued revenue growth through new products, geographic expansion, or secular tailwinds. Visa benefits from the global shift toward digital payments. Microsoft benefits from cloud adoption. These aren’t one-time boosts but multi-decade trends.
Building Your Dividend Growth Watchlist
Putting this all together, here’s a framework for building a watchlist of potential dividend growth investments:
Step 1: Screen for quality. Start with companies that have raised their dividend for at least 5 consecutive years, have ROIC above 15%, and payout ratios below 50%.
Step 2: Check the growth engine. Look at the 5-year dividend growth CAGR. Is it above 10%? Is it accelerating or decelerating? A slowing growth rate may signal that the best days are behind it.
Step 3: Verify with free cash flow. Pull the company’s 10-K from sec.gov and check that free cash flow (operating cash flow minus capital expenditures) comfortably exceeds dividend payments. If the company is borrowing to fund dividends, move on.
Step 4: Assess the runway. Does the company operate in a growing market? Is there room to expand margins or enter new markets? A company with a strong ROIC today but no growth runway ahead will eventually become a slow-growth, high-yield stock itself.
Step 5: Consider the price. Even the best dividend grower can be a poor investment if you overpay. Use a reverse DCF or a simple earnings yield framework to ensure you’re not paying 50x earnings for a company growing at 12%.
Common Mistakes to Avoid
Chasing yield without checking the payout ratio. This is the number one mistake. A 7% yield is meaningless if it gets cut to 3.5% next year.
Ignoring total return. Dividends are one component of your return. Share price appreciation matters too. A stock yielding 1% but growing its price at 15% annually will crush a stock yielding 6% with flat or declining share prices.
Assuming past dividend growth will continue forever. Dividend growth rates often slow as companies mature. Visa won’t sustain a 17% dividend growth rate forever. Build in some deceleration when modeling future income.
Confusing “yield on cost” with the current opportunity. Just because you’re earning a 10% yield on cost from a stock you bought ten years ago doesn’t mean someone buying today will get that same result. Yield on cost is a measure of your historical success, not a forward-looking metric.
Investor Takeaway
The single most important idea in this article: the starting yield is the least important variable in long-term dividend investing. What matters is the growth rate of that dividend and the business quality that sustains it.
A company yielding 1% today with 15% annual dividend growth will generate more income and more total wealth over 15 to 20 years than a company yielding 6% with 2% growth. The math is unambiguous.
When evaluating dividend stocks, focus on the engine behind the dividend: ROIC, payout ratio, free cash flow coverage, and revenue growth. Those four pillars indicate whether dividend growth can continue. The current yield? That’s just where the story begins.
As Buffett reminds us, “the best business to own is one that can employ large amounts of incremental capital at very high rates of return.” That applies to dividend investing just as much as it applies to buying entire companies.
That is going to wrap up our discussion for today.
As always, thank you for taking the time to read this post, and I hope you find something of value on your investing journey.
If I can further assist, please don’t hesitate to reach out.
Until next time, take care and be safe out there,
Dave
Hello School of Investing this post has got The IGP Paradox thinking.... in why "getting paid today" is often the most expensive mistake an investor can make. Fully on board with this—chasing a 7% yield is usually just a slow-motion car crash disguised as a "stable" investment.
The "Snowball" vs. The "Ice Cube"
The math here hits on the ultimate psychological hurdle: you have to be willing to look "underpaid" for a decade to be exponentially wealthy in the second.
I love your "Retained Earnings" logic. When a company like Visa keeps 75% of its profits, it isn't "withholding" your money—it’s hiring the world’s best engineers to turn your $1 into $1.30. A high-yield "Ice Cube" is essentially admitting, "We don't have any better ideas for this cash than you do," which is a pretty grim confession for a billion-dollar enterprise.
Question: The Desert Island Debate
If you were stuck on a desert island for 20 years, what would you prioritize: a high ROIC or a 50-year dividend streak? Personally, The IGP Paradox would take the ROIC every time. A "Dividend King" can easily become a victim of its own PR—squeezing the business dry just to keep a title while the engine starts to smoke.
What do you think: Is a high ROIC a better predictor of wealth than a long dividend history, or is the "King" title the ultimate proof of a durable moat?