
Dilution 101: Stock-Based Compensation, Buybacks, and Net Share Count — A Case/Accounting Deep Dive with Meta

Stock-based compensation (SBC) is an expense without a cash outflow today, but with a very real per-share cost tomorrow.
Quality investors require a clear, repeatable method to measure SBC, track net share count, and assess whether buybacks actually create value per share. In this case/accounting deep dive, we use Meta to show you the exact checks, reconciliations, and decision rules.
TL;DR
SBC is a real economic cost because it dilutes existing owners; treat it as cash-like in “owner earnings” even if GAAP adds it back via operating cash flow.
Focus on net share count, not just authorization headlines: Buyback dollars must exceed SBC and tax-withholding shares to shrink the float.
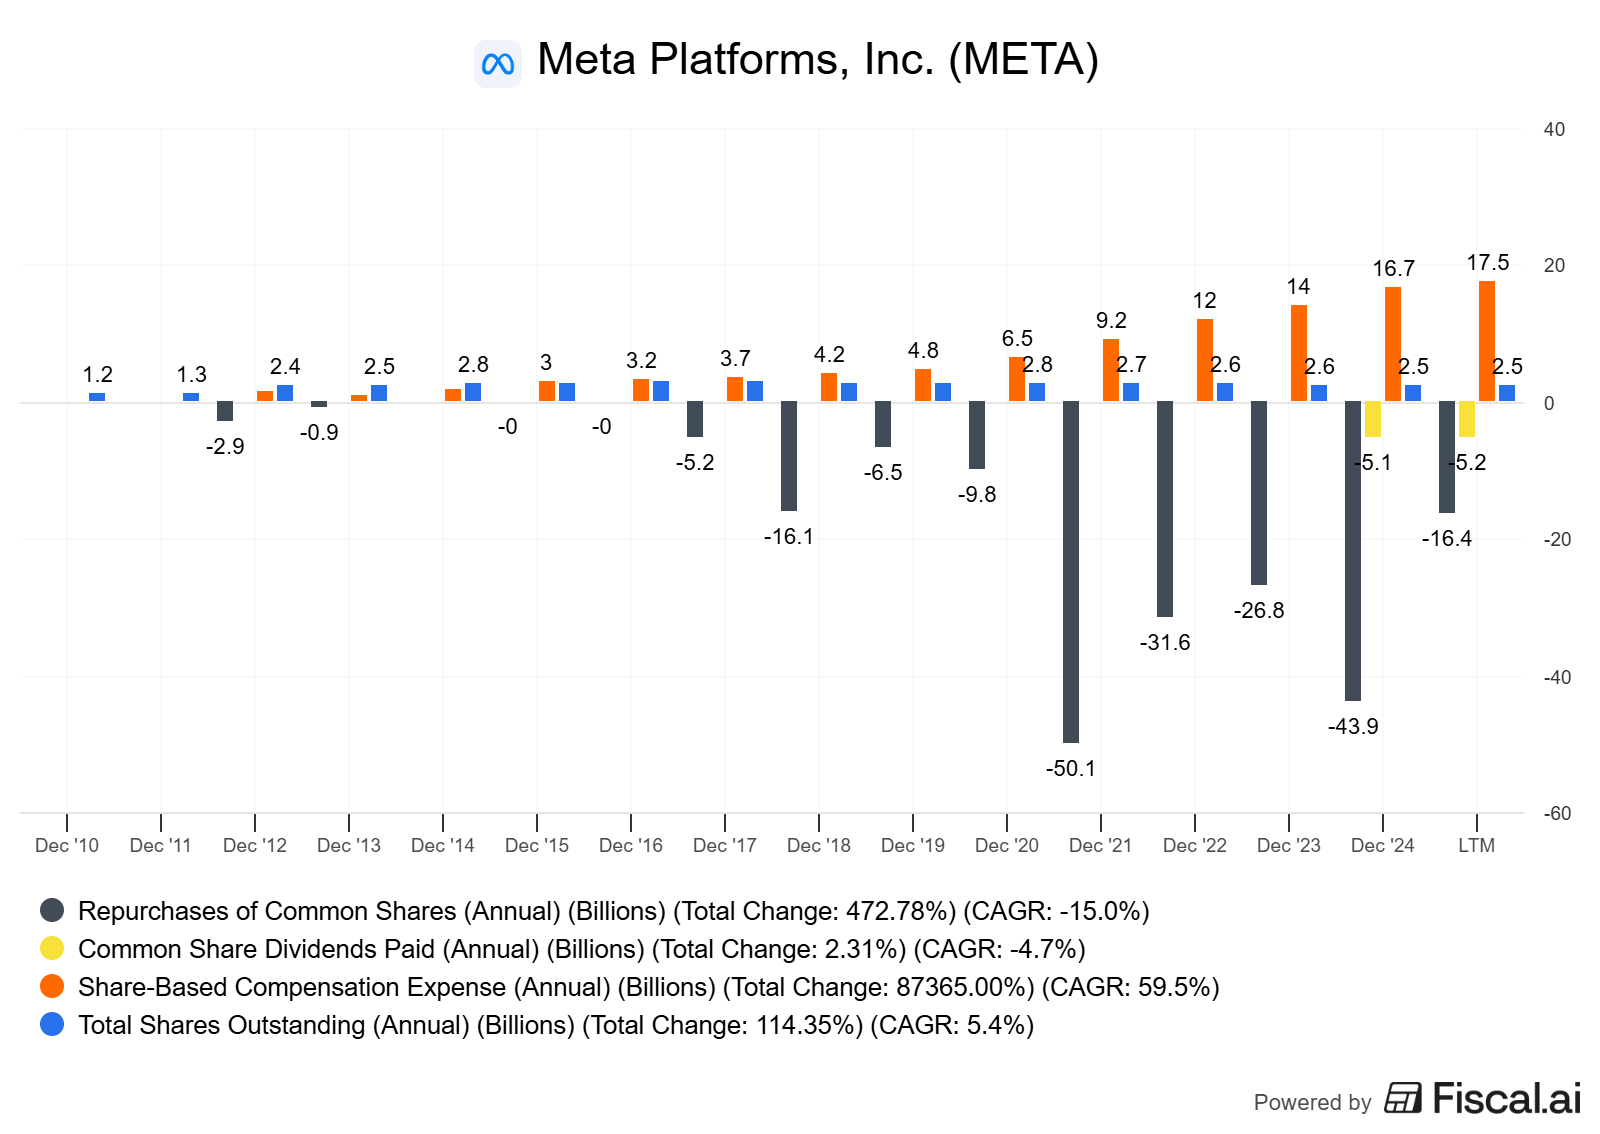
Meta provides a useful template: 2024 SBC ~$16.7B vs. ~$29.8B buybacks and ~$5.1B dividends; diluted weighted-average shares fell modestly year over year (as of Jan 29, 2025) Meta FY24 results.
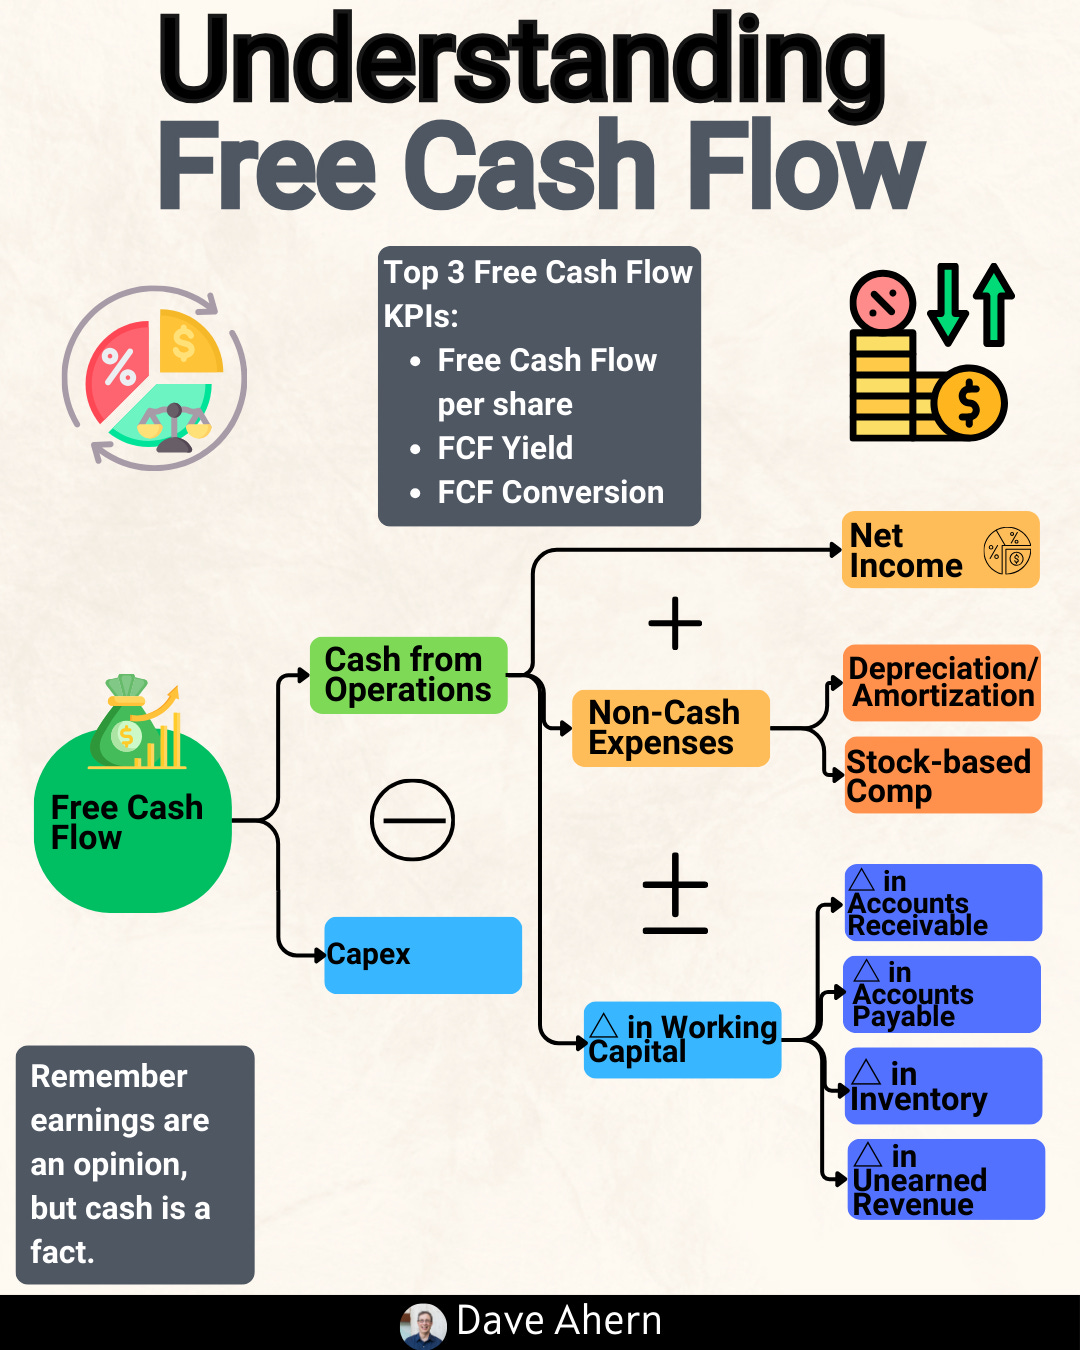
Build an “owner earnings” bridge: Start with FCF, then subtract SBC (and normalize working capital and maintenance capex) to see true distributable cash after dilution.
Decision rules: Prefer sustained ROIC – WACC > 5%, FCF conversion > 80% mid-cycle, net share count down ≥1% per year (averaged), and buyback/SBC coverage ≥1.5x over a cycle.
Why it matters
Dilution is a quiet tax on per-share compounding. SBC shifts ownership from current shareholders to employees; buybacks can either offset that dilution or amplify value per share if done at attractive prices. Quality investors care about:
Durability and unit economics (ROIC vs. WACC, margin stability).
Capital allocation discipline (reinvest vs. buyback vs. dividends).
Per-share value creation (not just aggregate growth).
Where investors go wrong:
Treating SBC as “non-cash” and ignoring it in valuation.
Looking at buyback authorizations instead of net share count.
Ignoring tax withholding shares that offset buyback effects.
Focusing on headline EPS while FCF/share and share count go the wrong way.
Core concepts
ROIC vs WACC and value creation
ROIC (return on invested capital) measures the cash returns on the capital required to operate the business. WACC is the blended hurdle rate that combines the costs of debt and equity.
Quality rule of thumb: Favor businesses with multi-year ROIC – WACC > 5% and low cyclicality. This creates headroom for buybacks to be accretive if priced below intrinsic value.
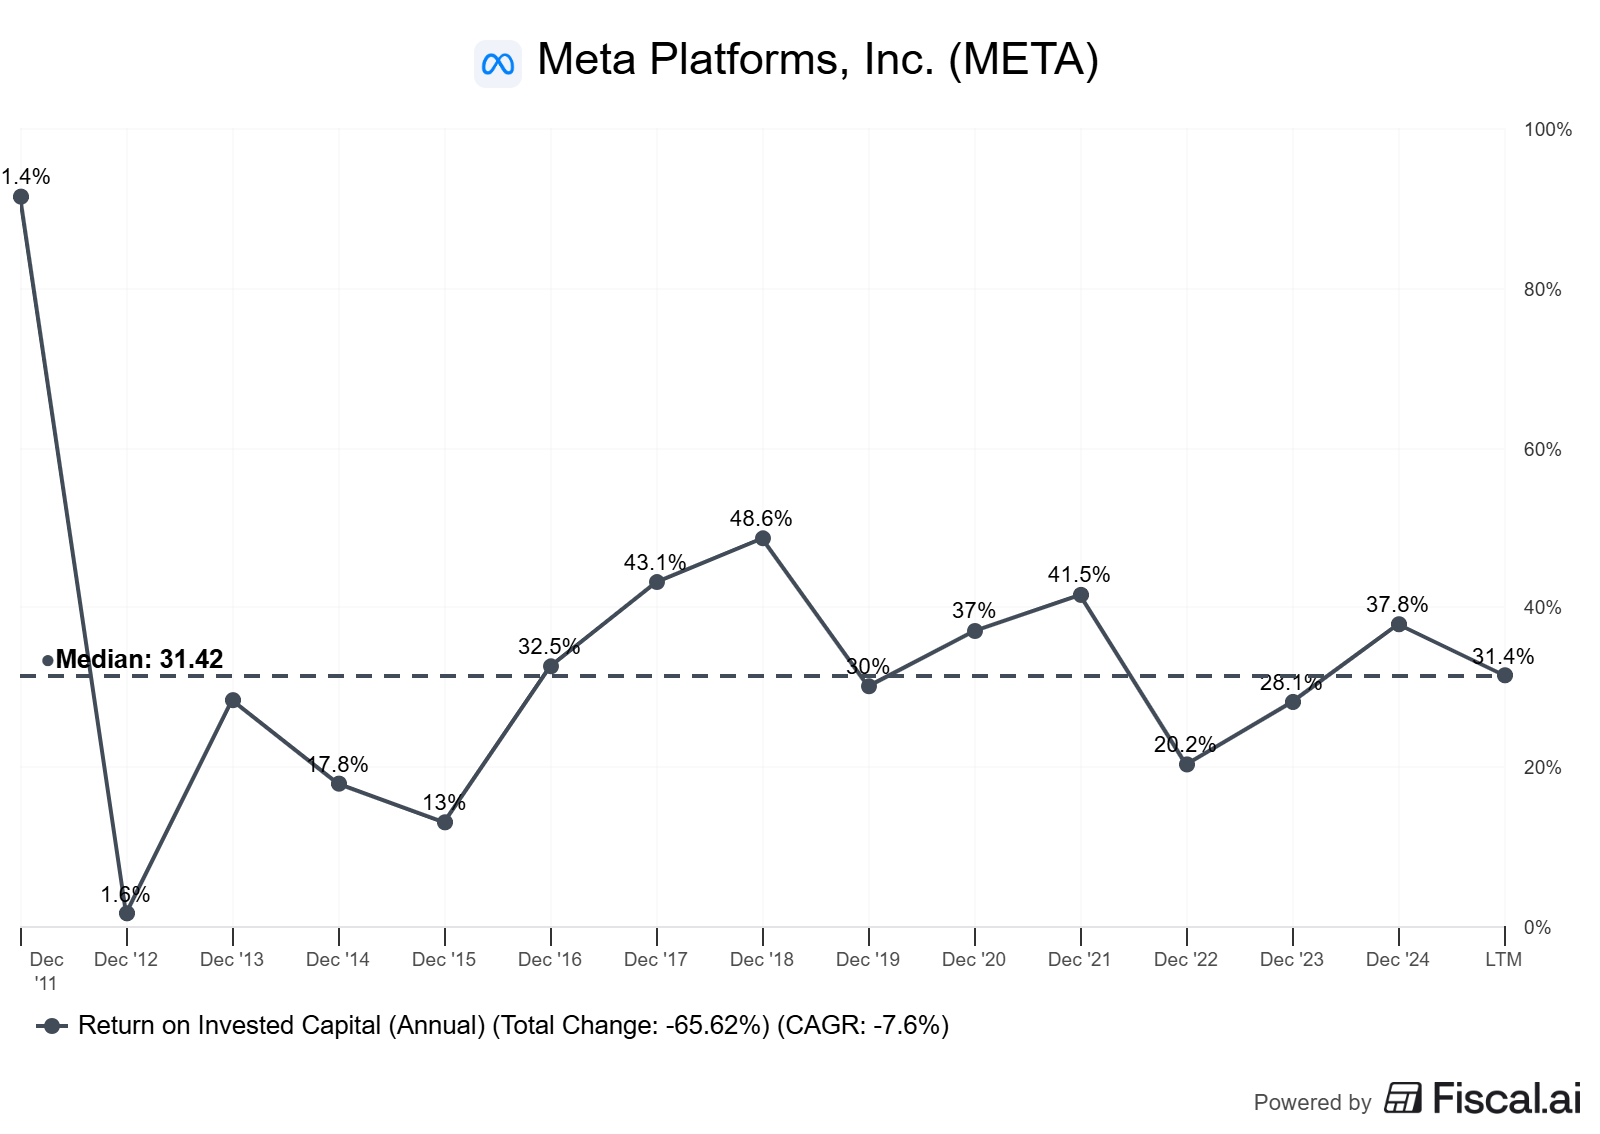
For large-cap platforms like Meta, long-term evidence suggests that ROIC has generally exceeded WACC, albeit with investment waves (such as AI capex and RL). Investors should recompute ROIC with mid-cycle margins.
Reinvestment runway and capital intensity
A long runway with high incremental returns is ideal. If reinvestment opportunities compress, buybacks/dividends become more attractive.
Capital intensity for AI infrastructure has risen sharply; watch depreciation step-ups and capex guidance.
Unit economics and per-share metrics
Track FCF conversion (FCF/NI), FCF margin, and per-share FCF/EPS trends.
Per-share framing: If profits grow 10% but share count grows 5%, per-share value creation is closer to 5%.
Moat durability and evidence (not claims)
Evidence beats narratives: sustained margin bands, high retention/engagement, pricing power (ad price per impression), and switching costs (ecosystem effects).
Mode-specific focus (Case/Accounting Saturday): bridges and economic reality
SBC accounting: GAAP expensing is non-cash, but dilution is real. OCF adds back SBC; FCF therefore implicitly includes the add-back. To estimate “owner earnings,” you should subtract SBC (and consider tax-withholding shares and buybacks) to capture economic cost to owners.
Buyback economics: Accretive only if repurchase price < intrinsic value and repurchases exceed dilution sources over time.
Worked example or mini case (mid-cap+; US)
We use Meta to show the mechanics of SBC, buybacks, and net share count. Meta is a large-cap US company with substantial SBC, buyback activity, and now dividends.
Key 2024 figures (as of Jan 29, 2025):
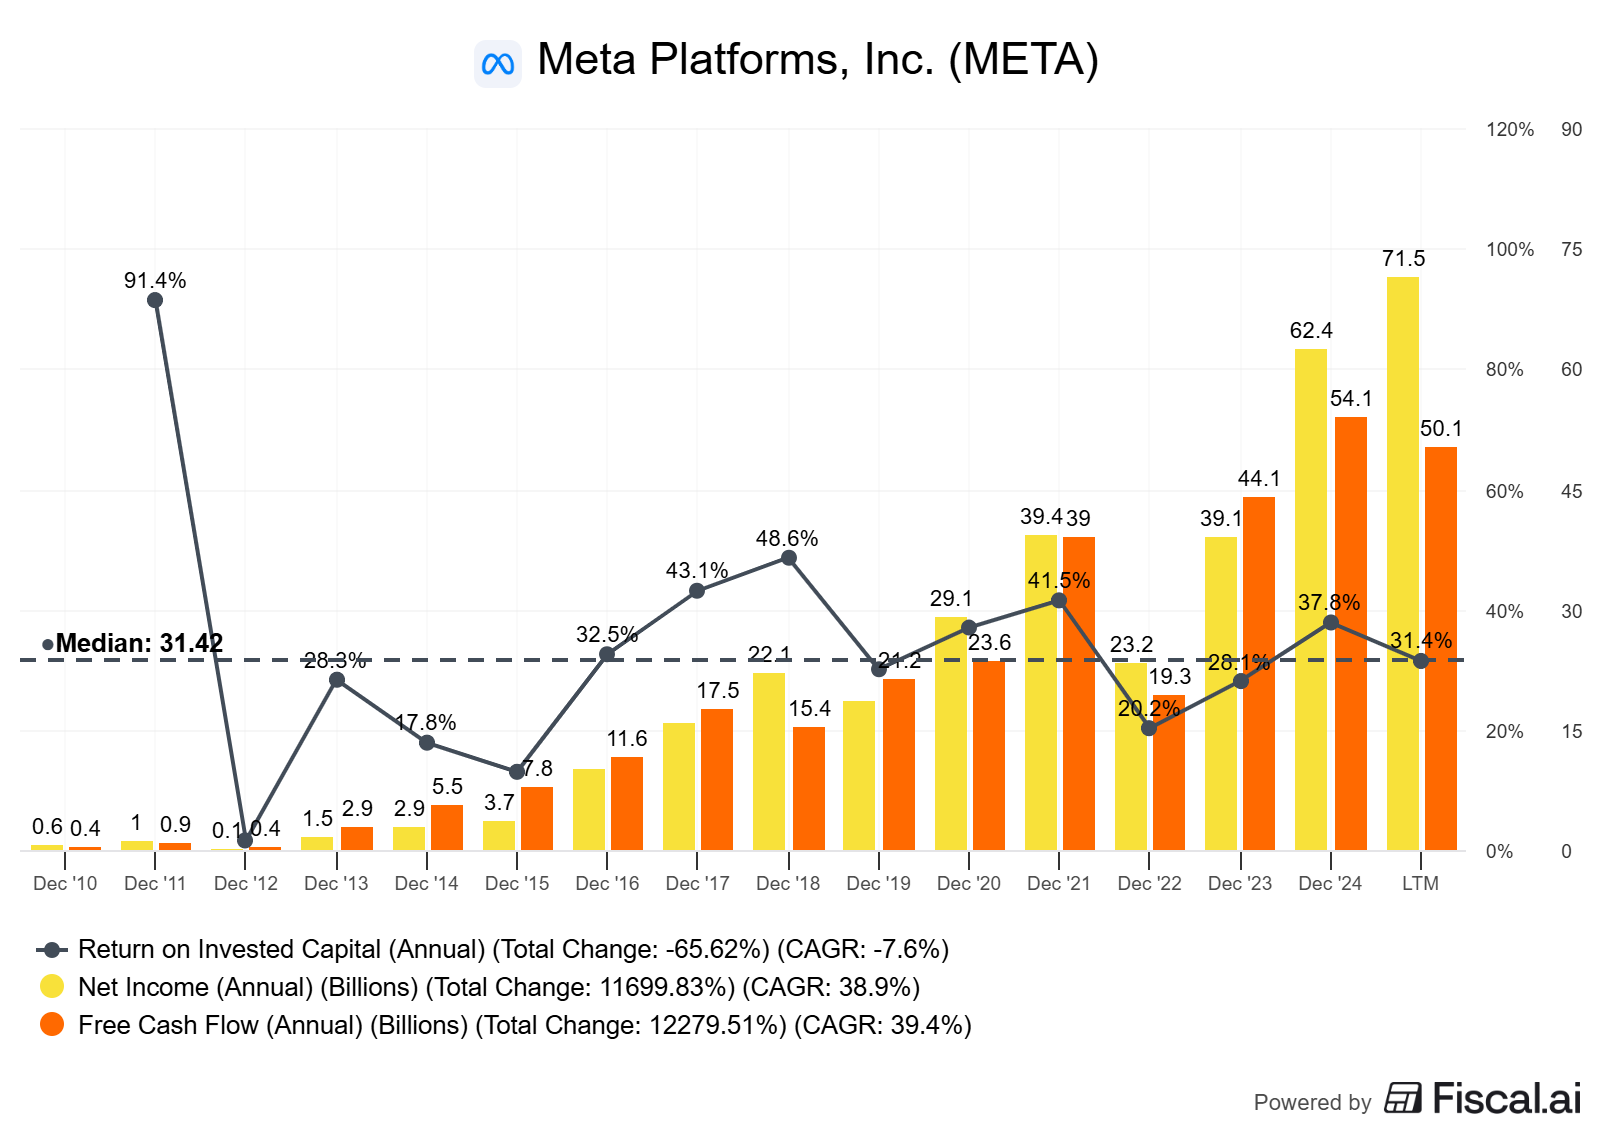
Revenue: $164.5B; Operating margin: 42%; Net income: $62.4B; FCF: $52.1B Meta FY24 results.
SBC: $16.7B in 2024 (vs. $14.0B in 2023). Source: cash flow reconciling line “Share-based compensation” FY24 press release.
Buybacks: $29.75B in 2024; Dividends paid: $5.07B (Meta initiated a quarterly dividend in 2024) FY24 press release.
Weighted-average diluted shares: 2,614M in 2024 vs 2,629M in 2023 (down ~0.6%) FY24 press release.
Shares outstanding: 2,189,898,148 Class A and 343,761,117 Class B as of Jan 24, 2025 (total ~2.534B) Meta 2024 Form 10-K.
2025 Q2 capital return snapshot: Q2’25 buybacks $9.76B, dividends $1.33B; FCF $8.55B for the quarter (as of Jul 30, 2025) Meta Q2’25 press release and SEC EX-99.1.
Earlier in 2024: Q1’24 buybacks $14.64B; dividends $1.27B (as of Apr 24, 2024) Meta Q1’24 10‑Q.
What this shows:
SBC is large in dollar terms. Buybacks must consistently exceed SBC and tax-withholding shares to move net share count down meaningfully.
Meta’s 2024 buyback/SBC coverage was ~1.8x ($29.75B / $16.69B), supportive of modest net dilution reversal. Weighted-average diluted shares fell ~0.6% YoY.
Dividends introduce an ongoing cash return layer. Combined with buybacks, they form a capital allocation mix that must be weighed against reinvestment needs (notably AI capex).
Owner earnings bridge (simplified):
Start with FCF (2024): $52.1B.
Subtract SBC (treat as cash-like economic cost): $16.7B.
Owner earnings proxy: ~$35.4B before other normalizations (maintenance capex, working-capital smoothing).
Interpretation: This is a “purist” lens to reflect the cost of issuing equity to employees. It’s conservative, and that’s the point—per-share discipline.
5–10 year trend notes (directional):
Per-share metrics: Diluted shares have trended down recently after periods of expansion (SBC-rich years), with buybacks accelerating in 2023–2025.
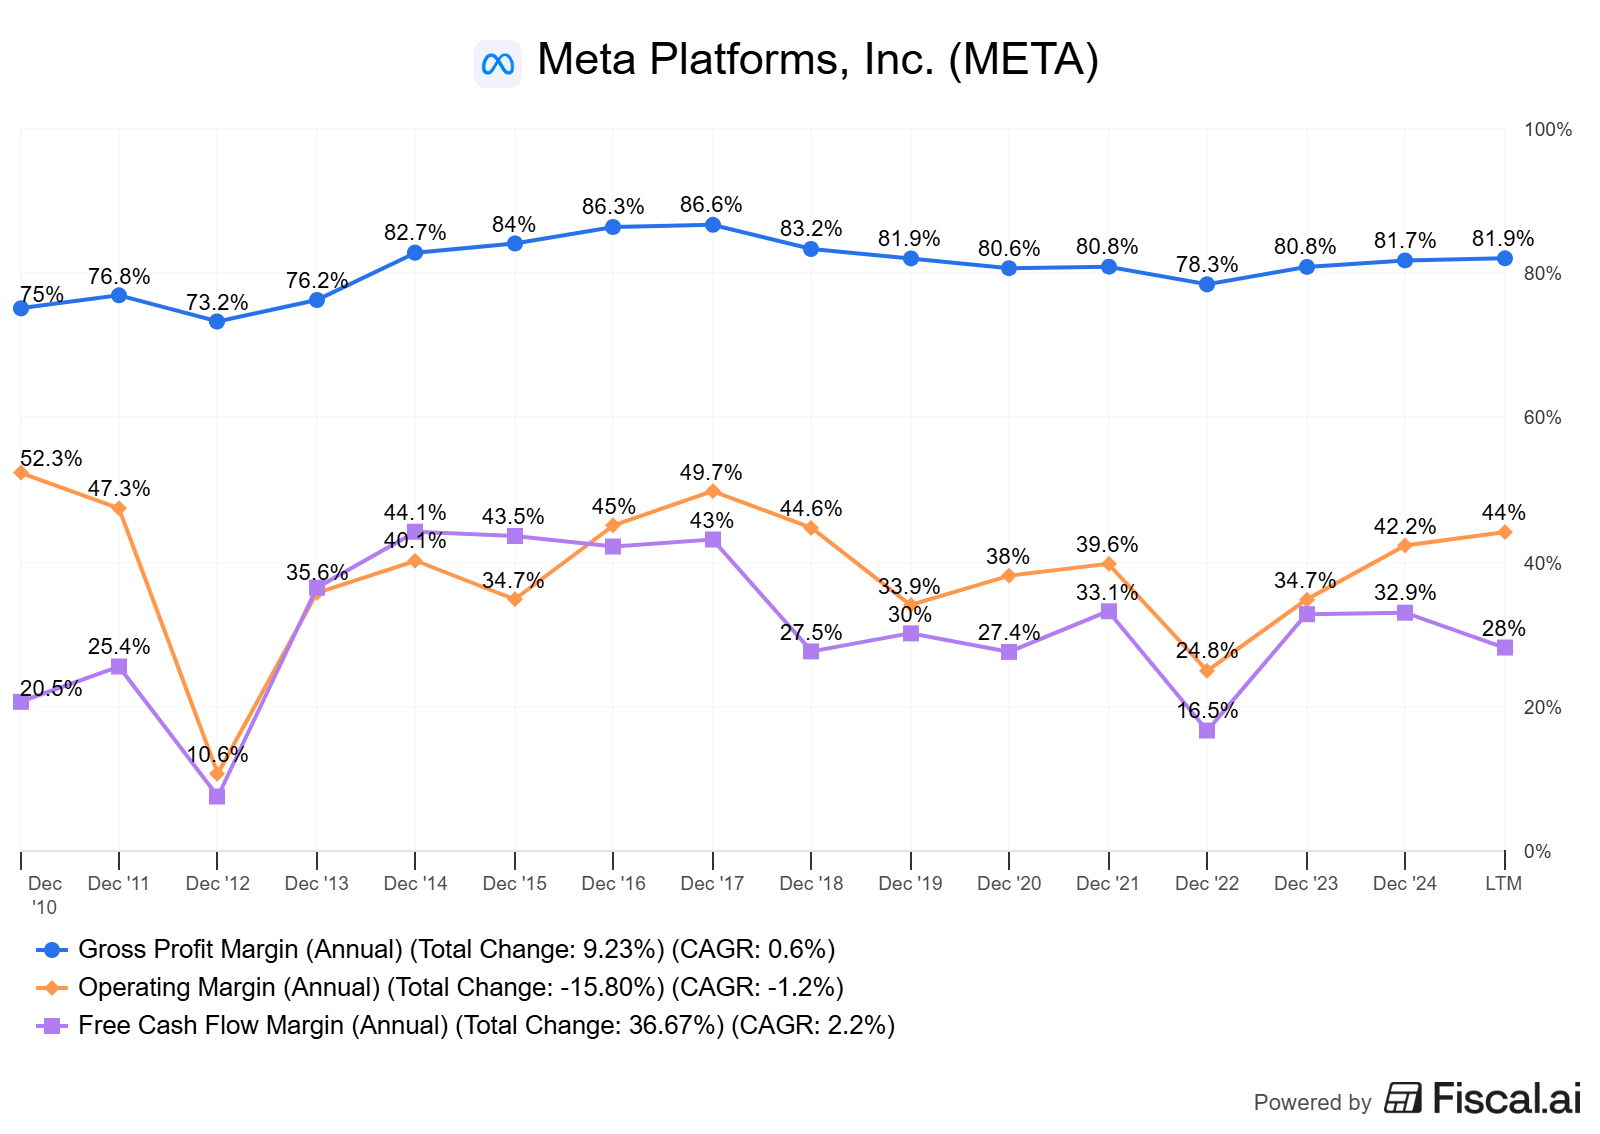
Margins: Operating margins compressed in 2022–2023 amid cost resets and investment cycles, then recovered in 2024 (42%).
Working capital: Advertising platforms tend to have favorable working-capital dynamics; track DSO/DIO/DPO and cash conversion cycle (CCC) for stability through cycles.
Valuation vs history: EV/FCF and EV/EBIT toggle around the 5–10 year medians as growth and capex expectations shift with AI infrastructure phases.
Caveats and alternative interpretations:
Treating SBC as a full cash-like cost in owner earnings can be conservative if buybacks are structured to offset it efficiently at attractive prices.
Weighted-average shares vs. end-of-period shares differ; judge trends over multiple years.
Reinvestment needs for AI can make buybacks less attractive at times; capital allocation should be dynamic.
How to do this yourself (step-by-step guide)
Data to gather (primary sources)
10-K/10-Q and earnings press releases for:
SBC (cash flow reconciliation).
Share repurchases and dividend payments.
Weighted-average diluted shares and shares outstanding.
Capex, depreciation, operating margin, FCF.
Investor presentations for capital allocation updates and segment mix.
Exact checks/calculations
Build a dilution ledger
SBC dollars (from cash flow add-back).
Shares issued/withheld for taxes (often disclosed indirectly via “Taxes paid related to net share settlement of equity awards”).
Share repurchases dollars and average prices (if disclosed).
Net share count (diluted WA and end-of-period).
Compute buyback coverage of SBC
Coverage = Buybacks / SBC.
Rule: Prefer ≥1.5x over a cycle; ≥1.0x is minimum to tread water.
Owner earnings proxy
Start with FCF.
Subtract SBC to reflect economic cost of dilution.
Normalize for working capital if you’re looking at a single period (mid-cycle view) and separate maintenance vs growth capex if estimable.
Per-share framing
Track FCF/share and EPS/share.
Track share count trend over 5–10 years.
ROIC vs WACC and reinvestment runway
Estimate NOPAT and invested capital; compare to WACC.
Decision rule: multi-year ROIC – WACC > 5% with stable margins supports ongoing buybacks when intrinsic value > market price.
Valuation cross-checks
EV/FCF and EV/EBIT vs 5–10y medians.
Sensitize owner-earnings-based yield for SBC variability.
Decision rules and thresholds
ROIC – WACC: target > 5% sustained.
FCF conversion: aim ≥ 80% mid-cycle for mature, high-margin platforms.
Buyback coverage of SBC: ≥ 1.5x over a cycle.
Net share count trend: ↓ ≥ 1% per year (averaged) is strong; flat to slight down is acceptable if reinvestment returns are compelling.
Moat signals: stable margins, pricing power, and engagement metrics through normal shocks.
Pitfalls and false positives (what commonly misleads investors)
Authorization vs execution: Announced buybacks do not equal shares retired.
SBC myopia: Calling it “non-cash” and ignoring the dilution.
EPS-only focus: EPS can rise while FCF/share stagnates if working capital or capex balloon.
Misreading tax-withholding shares: These are repurchases to meet payroll tax on vesting and do not reduce net share count much.
Cycle blindness: Using peak or trough margins to judge sustainable owner earnings.
Checklist / one-pager (actionable bullets readers can save)
Pull SBC (CF statement), buybacks/dividends (financing), share counts (EPS table + front matter).
Compute: Buybacks / SBC coverage, and net share change (YoY).
Build owner earnings: FCF – SBC; sanity-check vs multi-year average.
Assess ROIC – WACC and reinvestment needs before blessing buybacks.
Verify per-share metrics: FCF/share and EPS/share trend up ≥ mid-single-digit CAGR.
Confirm moat durability via margin bands and cash conversion cycle stability.
Cross-check EV/FCF and EV/EBIT vs 5–10y medians; avoid paying far above median if growth runway is not expanding.
Mini-FAQ
Q1: Isn’t SBC “non-cash”?
A: Today, yes. Economically, no. It transfers ownership from current shareholders to employees. Treat it as a real cost in owner earnings.
Q2: How do tax-withholding shares affect dilution?
A: On RSU vesting, companies often withhold shares to settle payroll taxes, then repurchase shares in the market. Those repurchases do not necessarily reduce net share count; they may just offset withholding.
Q3: When are buybacks accretive?
A: When the repurchase price is below intrinsic value and repurchases exceed dilution sources over time. Otherwise, they are neutral or even value-destructive.
Q4: Should I subtract all SBC from FCF?
A: As a conservative default. More nuanced approaches scale SBC by expected replacement needs and buyback execution, but “subtract all SBC” is a robust baseline.
Q5: Does a dividend change dilution math?
A: Not directly. Dividends are separate from SBC/buybacks. But dividends consume cash that could otherwise fund repurchases to offset dilution.
Glossary
Stock-Based Compensation (SBC): Equity awarded to employees (e.g., RSUs/options); a GAAP expense without a current cash outflow.
Net Share Settlement: Withholding a portion of vested shares to pay payroll taxes; often requires market repurchases to avoid share creep.
Owner Earnings: Investor-focused cash flow estimate that adjusts FCF for economic costs like SBC and normalizes for maintenance capex and working capital.
Buyback Coverage: Buyback dollars divided by SBC dollars over a period.
ROIC/WACC Spread: ROIC minus WACC; positive and durable spreads indicate value creation.
FCF Conversion: Free cash flow divided by net income; measures cash generation quality.
Cash Conversion Cycle (CCC): DSO + DIO – DPO; lower or negative CCC implies working-capital efficiency.
Per-Share Framing: Evaluating results on a per-share basis (EPS, FCF/share) to reflect true owner outcomes.
Further reading (linked, with dates)
Meta FY2024 press release (Jan 29, 2025): Meta Reports Fourth Quarter and Full Year 2024 Results (2025-01-29)
Meta Q2 2025 press release: Meta Reports Second Quarter 2025 Results (2025-07-30)
SEC filing (10-K FY2024): Meta Platforms, Inc. 2024 Form 10-K (filed 2025-01-29)
Meta Q1 2024 10-Q (SBC, buybacks snapshot): meta-20240331 (2024-04-19)
References (linked source list with “as of” dates)
Meta Investor Relations — FY2024 results press release, including SBC, buybacks, dividends, and financial statements: Meta Reports Fourth Quarter and Full Year 2024 Results — as of 2025-01-29.
Meta Investor Relations — Q2 2025 results press release (capital return, capex, FCF): Meta Reports Second Quarter 2025 Results — as of 2025-07-30. See also SEC EX‑99.1 — as of 2025-07-30.
SEC — Meta 2024 Form 10-K (shares outstanding, accounting details): meta-20241231 — as of 2025-01-29.
SEC — Meta Q1 2024 10-Q (repurchases/dividends snapshot): meta-20240331 — as of 2024-04-19.
Disclaimer
Educational content, not investment advice.
This is an excellent breakdown of the SBC dilution mechanics. The owner earnings bridge approach (FCF minus SBC) really helps clarify the economic reality that many invstors overlook when they treat SBC as purely 'non-cash'. Your emphasis on buyback coverage ratios and net share count trends over time is especially valuable - it's so easy to get distracted by authorization headlines instead of actual execution. The Meta case study with the 1.8x buyback/SBC coverage is a great real-world example of how to assess whether management is genuinely offsetting dilution.