COGS vs OPEX: What are the differences and what should we know as investors?

Understanding the split between Cost of Goods Sold (COGS) and Operating Expenses (OPEX) turns the income statement from a scoreboard into a diagnostic tool.
COGS describes what it costs to produce and deliver what you sell. OPEX describes what it costs to run the company.
Each moves for different reasons and tells you something different about competitive advantage, scale, and cycle exposure.
What counts as COGS vs. OPEX
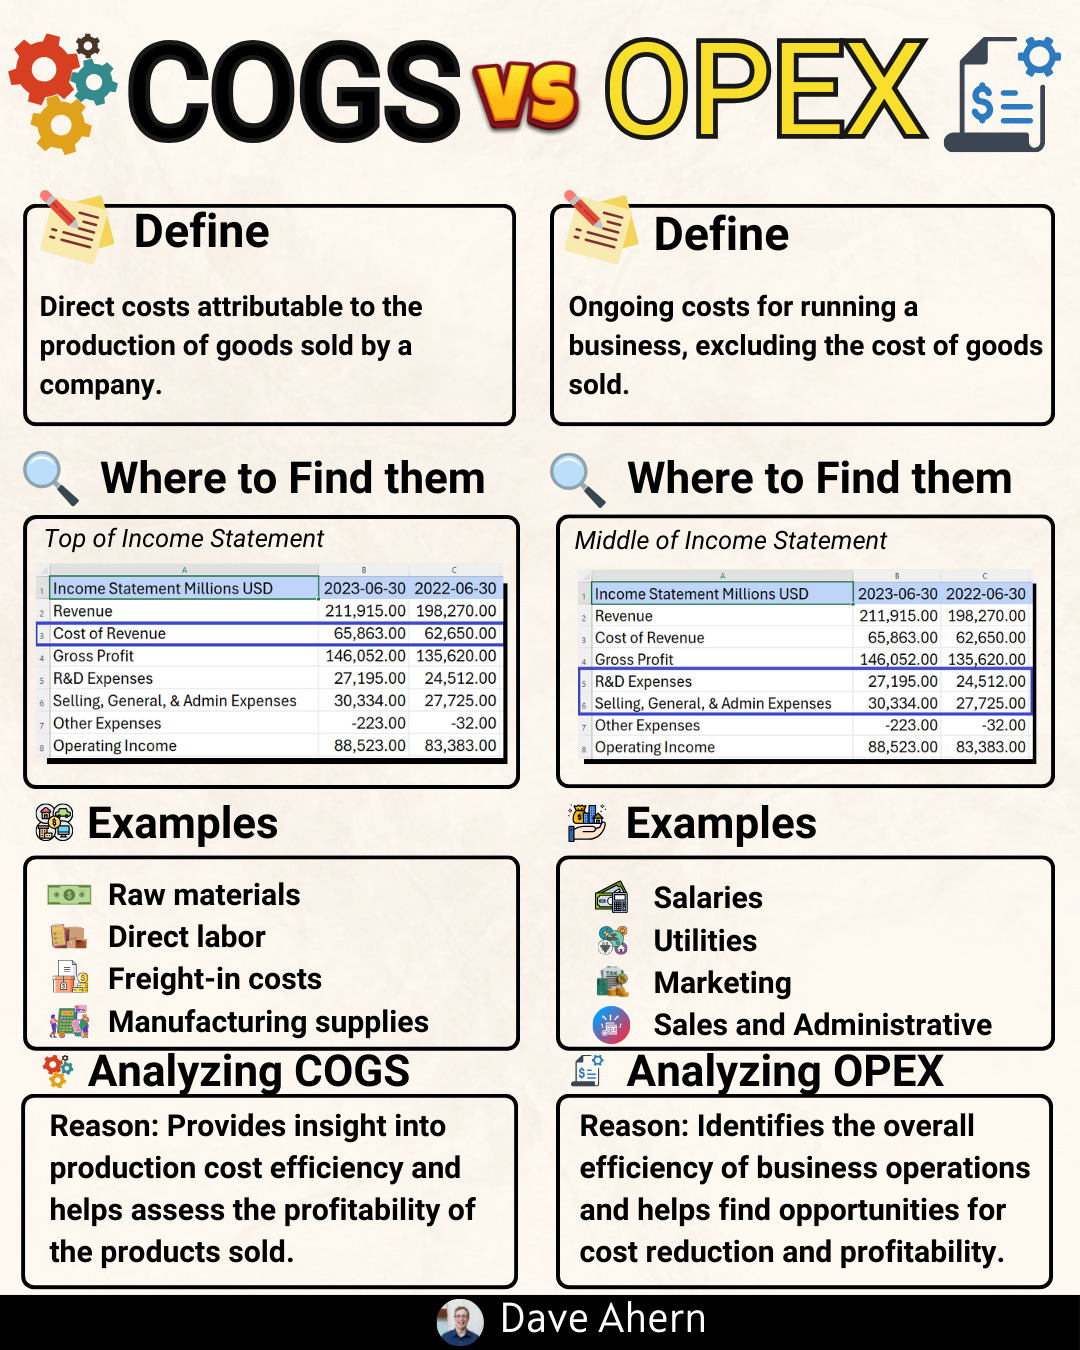
COGS are the direct costs tied to producing the goods or services a company sells.
Think inputs and factory floors: raw materials, direct labor, and manufacturing overhead (like depreciation on production equipment, utilities for the plant, and quality control). On the income statement, you’ll see COGS directly under revenue; revenue minus COGS is gross profit, and gross profit divided by revenue is gross margin.
Gross Margin = (Revenue − COGS) / Revenue × 100%
OPEX are the costs to operate the business that aren’t directly part of making the product.
These are typically research and development (R&D) and selling, general, and administrative (SG&A): salaries for corporate staff, sales and marketing, product engineering (for tech), IT, rent, and professional fees.
OPEX sits below gross profit; gross profit minus OPEX is operating income, and dividing that by revenue gives you the operating margin.
Operating Margin = Operating Income / Revenue × 100%
Two practical nuances help intermediate investors.
First, a lot of “manufacturing” cost is fixed. Under absorption costing, fixed factory costs (like depreciation on equipment) sit in COGS and get spread over every unit produced; when volume drops, those fixed costs get spread over fewer units, so COGS per unit rises and gross margin compresses.
Second, product mix and yield matter: if you sell more of your higher‑margin products or improve yields, gross margin can expand even if total revenue is flat.
Case study: how COGS and OPEX work at Taiwan Semiconductor (TSMC)
As the world’s leading pure‑play semiconductor foundry, TSMC is the textbook example of a business where fixed manufacturing costs dominate COGS and OPEX is concentrated in R&D.
What’s inside COGS for a foundry?
In a chip fab, COGS includes silicon wafers and specialty chemicals and gases, reticles and consumables, direct factory labor, equipment maintenance and spare parts, facility costs (cleanroom utilities like electricity and ultrapure water), and—critically—depreciation on extreme ultraviolet (EUV) and other lithography tools and fab buildings.
Depreciation is typically the single largest line, reflecting the industry’s heavy capital intensity. Because so much of that is fixed, utilization is the single most important swing factor for gross margin: when fab utilization falls, unit costs rise; when it rises, costs fall, and margins expand.
Mix also matters: leading‑edge nodes (for example, 3nm) command higher average selling prices and, when yields mature, typically carry better margins than trailing nodes.
What’s inside OPEX for a foundry?
OPEX for TSMC is mainly R&D and SG&A. R&D covers process technology development (advancing from N5 to N3 to N2), design enablement libraries and IP, advanced packaging (CoWoS, InFO, SoIC), and related engineering talent. SG&A is relatively lean in a foundry model: sales support, customer engineering, corporate functions, and IT. Relative to many software or fabless chip designers, foundry OPEX as a percent of revenue is lower because a bigger share of total economics flows through COGS via depreciation.
In practice, TSMC’s R&D intensity tends to run in the high single digits of revenue, while SG&A tends to run in the low single digits. Exact figures vary by quarter and cycle and are disclosed in TSMC’s income statements.
How to analyze TSMC’s COGS and OPEX step by step.
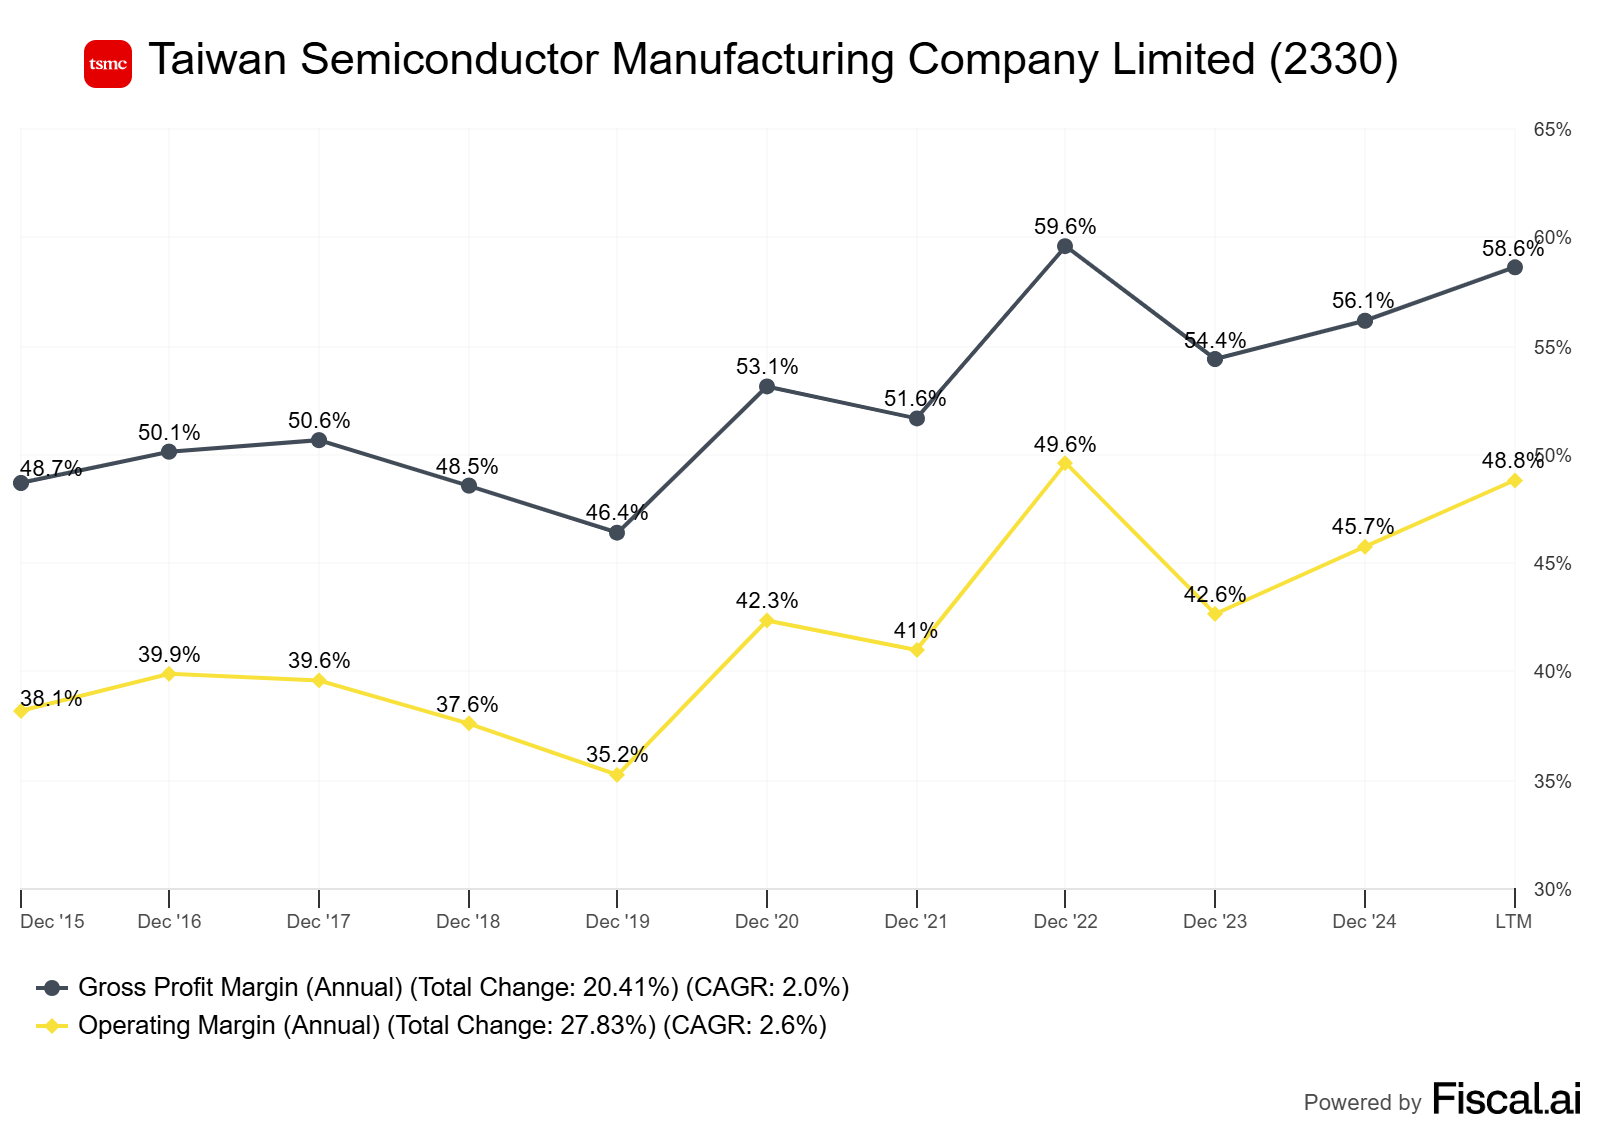
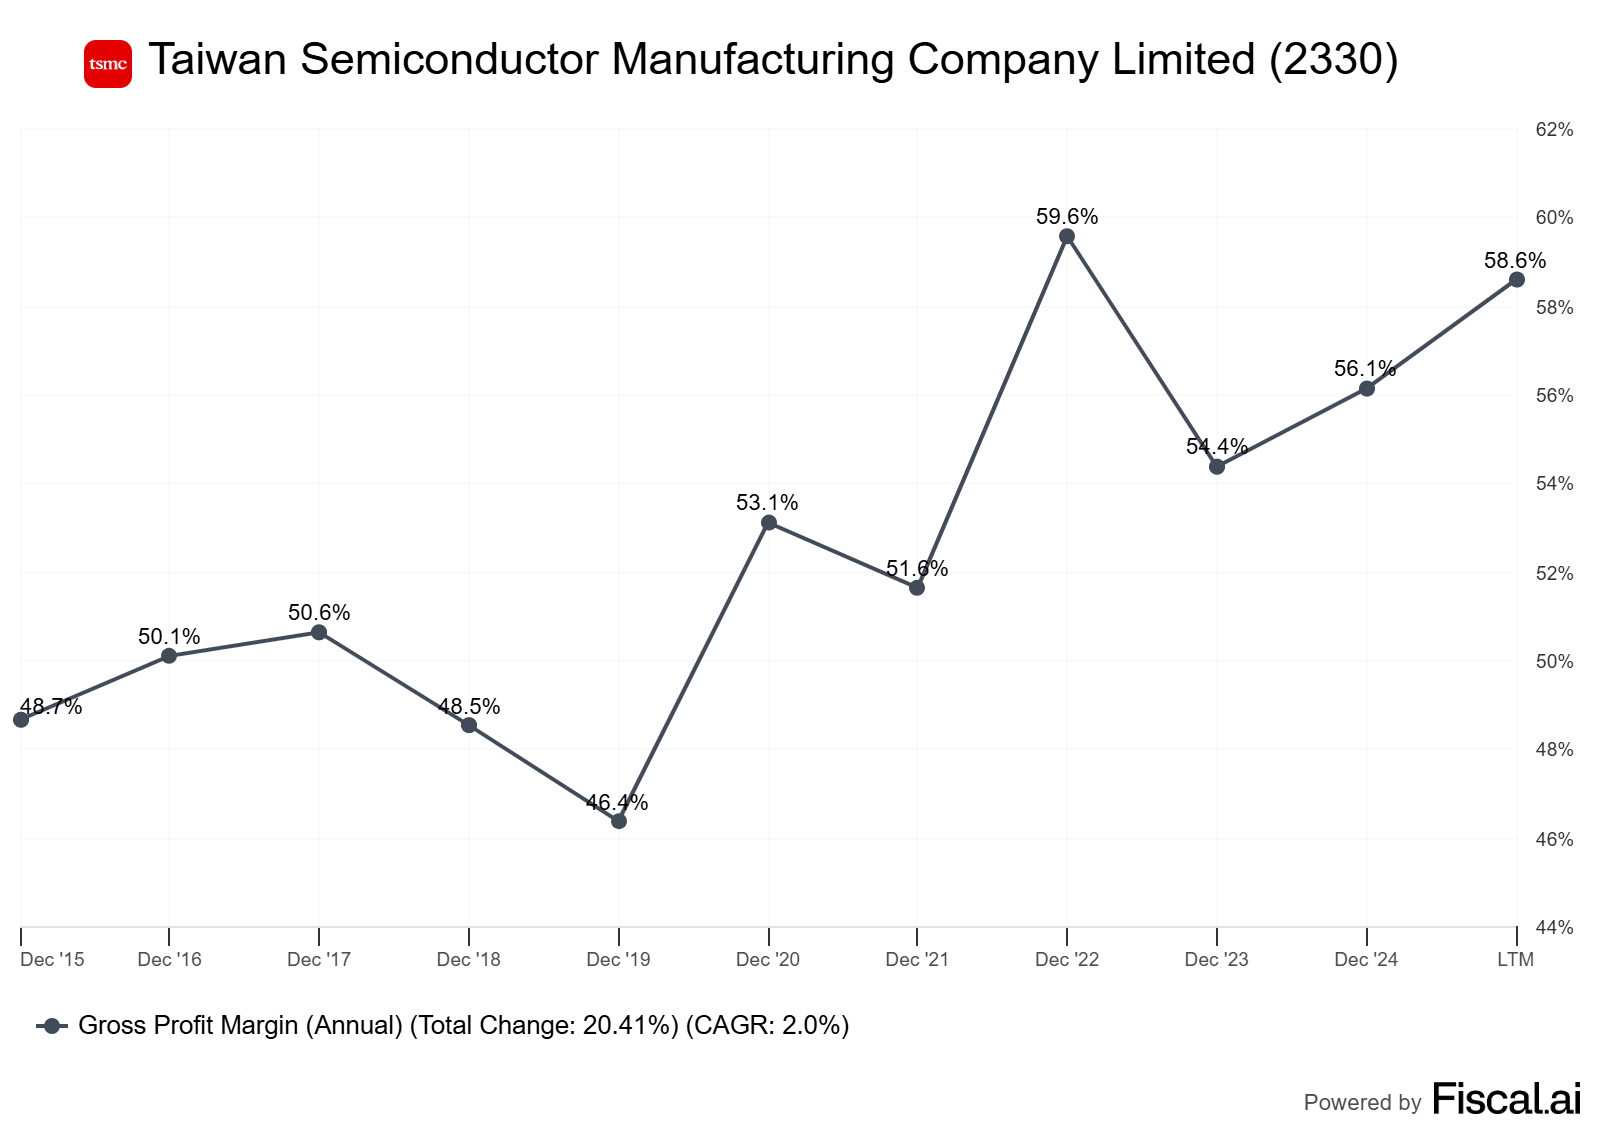
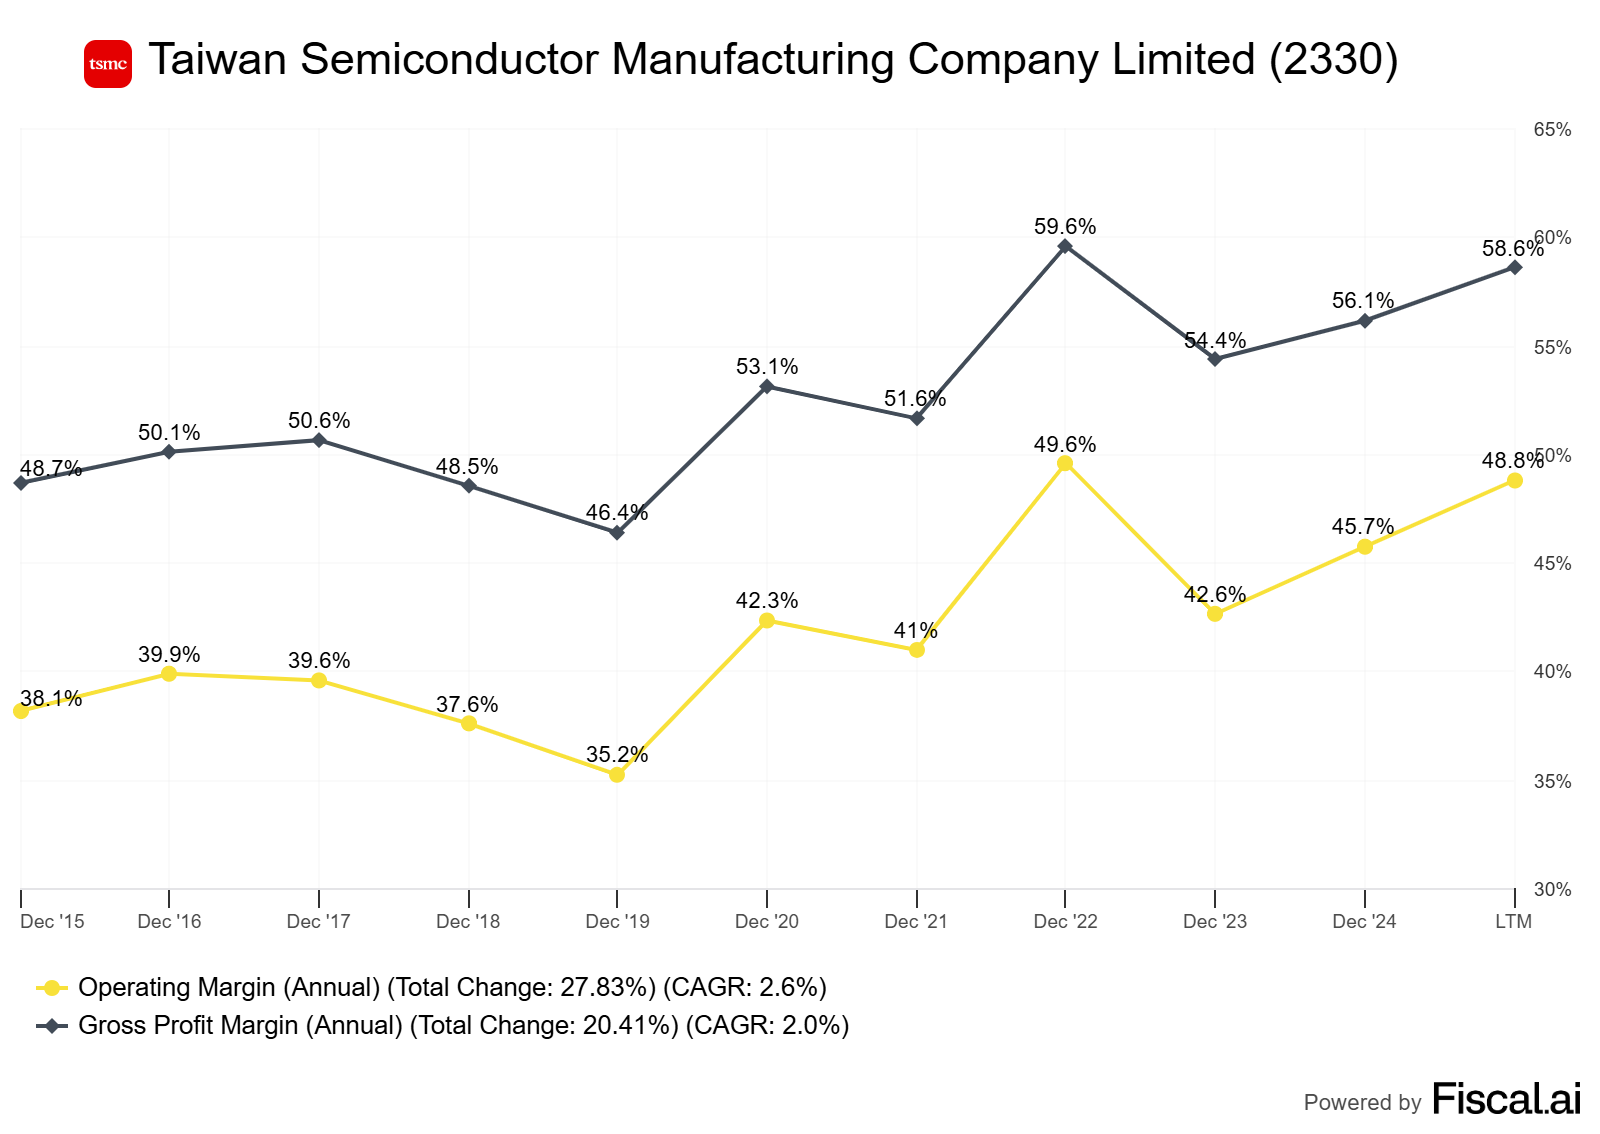
Start with gross margin trends across cycles. When smartphone/PC demand slowed, TSMC’s utilization and mix shifted, and gross margin compressed; when AI/HPC demand surged and advanced nodes ramped, utilization tightened and mix improved, lifting gross margin.
Read management commentary for drivers like nodal yield ramps, pricing, electricity tariffs, and Taiwan dollar (TWD) versus USD movements; a stronger TWD pressures reported gross margin for a USD‑denominated revenue base.
Then examine R&D and SG&A as percents of revenue. R&D typically spikes ahead of a new node ramp and normalizes as the node matures; SG&A should show operating leverage over time.
Finally, tie it together at operating margin: high fixed COGS plus measured OPEX growth should produce operating leverage as volume and mix improve.
A quick illustrative walk‑through (hypothetical math to show mechanics).
Suppose TSMC reports revenue of NT$2,100B and cost of revenue (COGS) of NT$1,000B; gross margin is about 52.4%. If R&D is NT$160B (~7.6% of revenue) and SG&A is NT$70B (~3.3%), total OPEX of ~11% yields operating income of roughly NT$870B and an operating margin near 41%.
The point isn’t the exact numbers; it’s seeing how utilization and mix primarily move gross margin, while OPEX discipline and scale drive operating leverage.
Comparisons: how TSMC’s structure differs from peers
Versus other foundries (UMC, GlobalFoundries, Samsung’s foundry business), TSMC typically earns higher gross margins because it leads on advanced nodes, captures higher ASPs, and keeps utilization high through diversified customer demand.
Foundries focused on mature nodes generally show lower gross margins due to more commoditized pricing and tighter customer concentration. Versus integrated device manufacturers (IDMs) like Intel, where fabrication and product divisions are intertwined, line‑item comparability can be tricky; reporting changes (like Intel’s new foundry segment disclosures) help, but watch for internal transfer pricing and corporate allocations that can blur COGS vs. OPEX comparisons.
Versus fabless designers (NVIDIA, AMD, Qualcomm), the split flips: fabless companies carry high OPEX (especially R&D often north of 20% of revenue) and relatively lower COGS because their largest “manufacturing” cost is the wafer price they pay to foundries like TSMC. That’s why you’ll see fabless firms with high gross margins but much higher OPEX ratios; foundries show lower gross margins than fabless leaders but significantly lower OPEX intensity.
What drives the trends for TSMC
Utilization and product mix are the first‑order drivers.
When advanced nodes (3nm today, N2 next) represent a larger share of wafer starts and yields improve, COGS per good die falls and gross margin rises. Capacity adds and depreciation are the second‑order drivers.
Each EUV tool and new fab adds a large fixed depreciation charge to COGS; until that capacity fills, gross margin is pressured. Energy and input costs matter at the margin; rising electricity tariffs in Taiwan or supply chain constraints for specialty gases lift COGS. Currency can be a swing factor, given USD‑denominated pricing and NT$ reporting. In OPEX, R&D intensity pulses around node transitions and advanced packaging roadmaps; SG&A should scale slower than revenue in healthy periods, showing operating leverage.
The tell for investors is the path of gross margin and OPEX as a percent of revenue across the cycle: in upcycles, you want to see both gross margin expand and OPEX ratio fall; in downcycles, gross margin compresses first, and disciplined operators hold OPEX growth in check to protect operating margins.
Practical checklist you can apply to TSMC (and any manufacturer)
Map COGS into fixed and variable buckets. Depreciation, facilities, and much of labor are fixed; materials and consumables are more variable. This frames your view on how sensitive gross margin is to volume.
Track utilization, mix, and yield from management commentary. Rising utilization and better mix should pre‑announce gross margin expansion before the numbers peak.
Trend R&D and SG&A as a percent of revenue and per unit of output (if disclosed). Look for operating leverage in SG&A and intentional R&D spikes tied to new process nodes and packaging.
Watch depreciation cadence and capex guidance. Today’s capex is tomorrow’s COGS via depreciation; big step‑ups in capex foreshadow gross margin headwinds until new capacity fills.
Adjust for currency and power price changes where relevant. FX can alter reported gross margin independent of operational performance; energy tariffs directly affect COGS for fabs.