
Cash-Mapping Multiples: Why EV/EBIT vs EV/FCF Diverge for Google and Meta

EV/EBIT and EV/FCF are cousins, not twins. In periods of reinvestment, they can tell starkly different valuation stories about the same company. This matters today because both Alphabet and Meta are deep in an AI infrastructure build-out that compresses free cash flow.
If you only look at one multiple, you may misread durability, runway, and the real price of growth.
TL;DR
EV/EBIT is cleaner for core economics; EV/FCF prices timing of capex and working capital. In capex waves, they diverge.
Quality lens: prefer sustained ROIC above WACC by 5%+ and strong FCF conversion through the cycle, not every quarter.
Alphabet guided roughly $85B capex for 2025 and Meta guided $66–72B, temporarily depressing FCF yields while EBIT and margins remain strong [Alphabet Q2’25; Meta Q2’25].
To value right now: run a 3-scenario cash conversion map that links EBIT to FCF via capex intensity and working capital.
Decision rule: when EV/FCF looks “expensive,” but EV/EBIT and ROIC are strong and capex is building durable moats, don’t anchor on trough FCF.
Use per-share framing (buybacks/dividends vs SBC) and normalize for mid-cycle capex.
Why it matters
Base rates: Most firms cannot compound at high ROICs while reinvesting heavily for a long time. The ones that do generate outlier wealth. The market misprices them most often during heavy reinvestment phases when FCF appears weak.
Where investors go wrong:
Treat EV/FCF as a superior “all seasons” metric without adjusting for capex cycles.
Ignore whether capex is growth or maintenance.
Underweight per-share economics and SBC dilution.
Over-trust management “AI capex” narratives without evidence of returns (pricing power, retention, incremental margins).
Core concepts
ROIC vs WACC and value creation
ROIC (after-tax) above WACC indicates value creation. The spread size and durability matter.
For platforms like Alphabet and Meta, ROIC is often buoyed by intangible assets (software, data, network effects), while invested capital balloons in build-out periods. A temporarily lower ROIC does not automatically signal value destruction if future unit economics are strong and the runway is long.
Reinvestment runway and capital intensity
Reinvestment runway = opportunity size × ability to deploy at high ROIC.
Capital intensity: how much capex and working capital are needed to support growth. AI data centers increase near-term capital intensity for both Alphabet and Meta.
Depreciation lags capex; EBIT captures current operating profit, not current capex cash outflows. EV/EBIT ignores timing; EV/FCF reflects it.
Unit economics and per-share metrics
Focus on incremental margins, FCF conversion, and retention.
Per-share framing: Are buybacks accretive relative to intrinsic value? Do dividends make sense given the runway? How large is SBC vs. operating cash flow?
Moat durability and evidence (not claims)
Evidence: stable or expanding gross/operating margins across cycles, pricing power (ad pricing, CPC), high retention/engagement, switching costs, and ecosystem control.
Claims (e.g., “AI leadership”) should show up in customer adoption, backlog, mix shift, and sustainable margins.
Valuation frameworks and scenarios
EV/EBIT anchors on operating earnings from the existing base. Useful when capex timing is noisy.
EV/FCF focuses on “owner cash” after reinvestment. Better for steady-state or mid-cycle assessments.
Practical approach for capex waves:
Map EBIT → FCF with explicit capex and working capital paths.
Build 3 scenarios: conservative (higher capex, slower conversion), base, and optimistic (capex productivity improves; conversion normalizes faster).
Sanity-check with ROIC mid-cycle and compare implied EV/FCF/EV/EBIT to 5–10y medians.
Worked example: Alphabet vs. Meta
Scope: U.S. large-cap platforms undergoing AI infrastructure investment. We use recent reported figures and guidance; exact multiples vary with prices/EV.
Evidence sources: Alphabet FY2024 results and Q2’25 release/guidance; Meta FY2024 results and Q2’25 release/guidance.
Alphabet FY2024: Revenue $350B, operating margin 32%, net income $100B; strong growth across Search/YouTube/Cloud. The company flagged a significant 2025 capex of approximately $75B in February (later revised to around $85B) as AI infrastructure ramps up for Alphabet's FY2024 release, as of February 4, 2025. This was also mentioned in the Q2’25 press release, as of July 23, 2025.
Meta FY2024: Revenue $164.5B, operating margin 42%, FCF $52.1B, capex $39.2B; Q2’25 capex $17.0B for the quarter; FY2025 capex guidance raised to $66–72B Meta FY2024 release, as of Jan 29, 2025; Meta Q2’25 release, as of Jul 30, 2025; also PRNewswire, as of Jul 30, 2025.
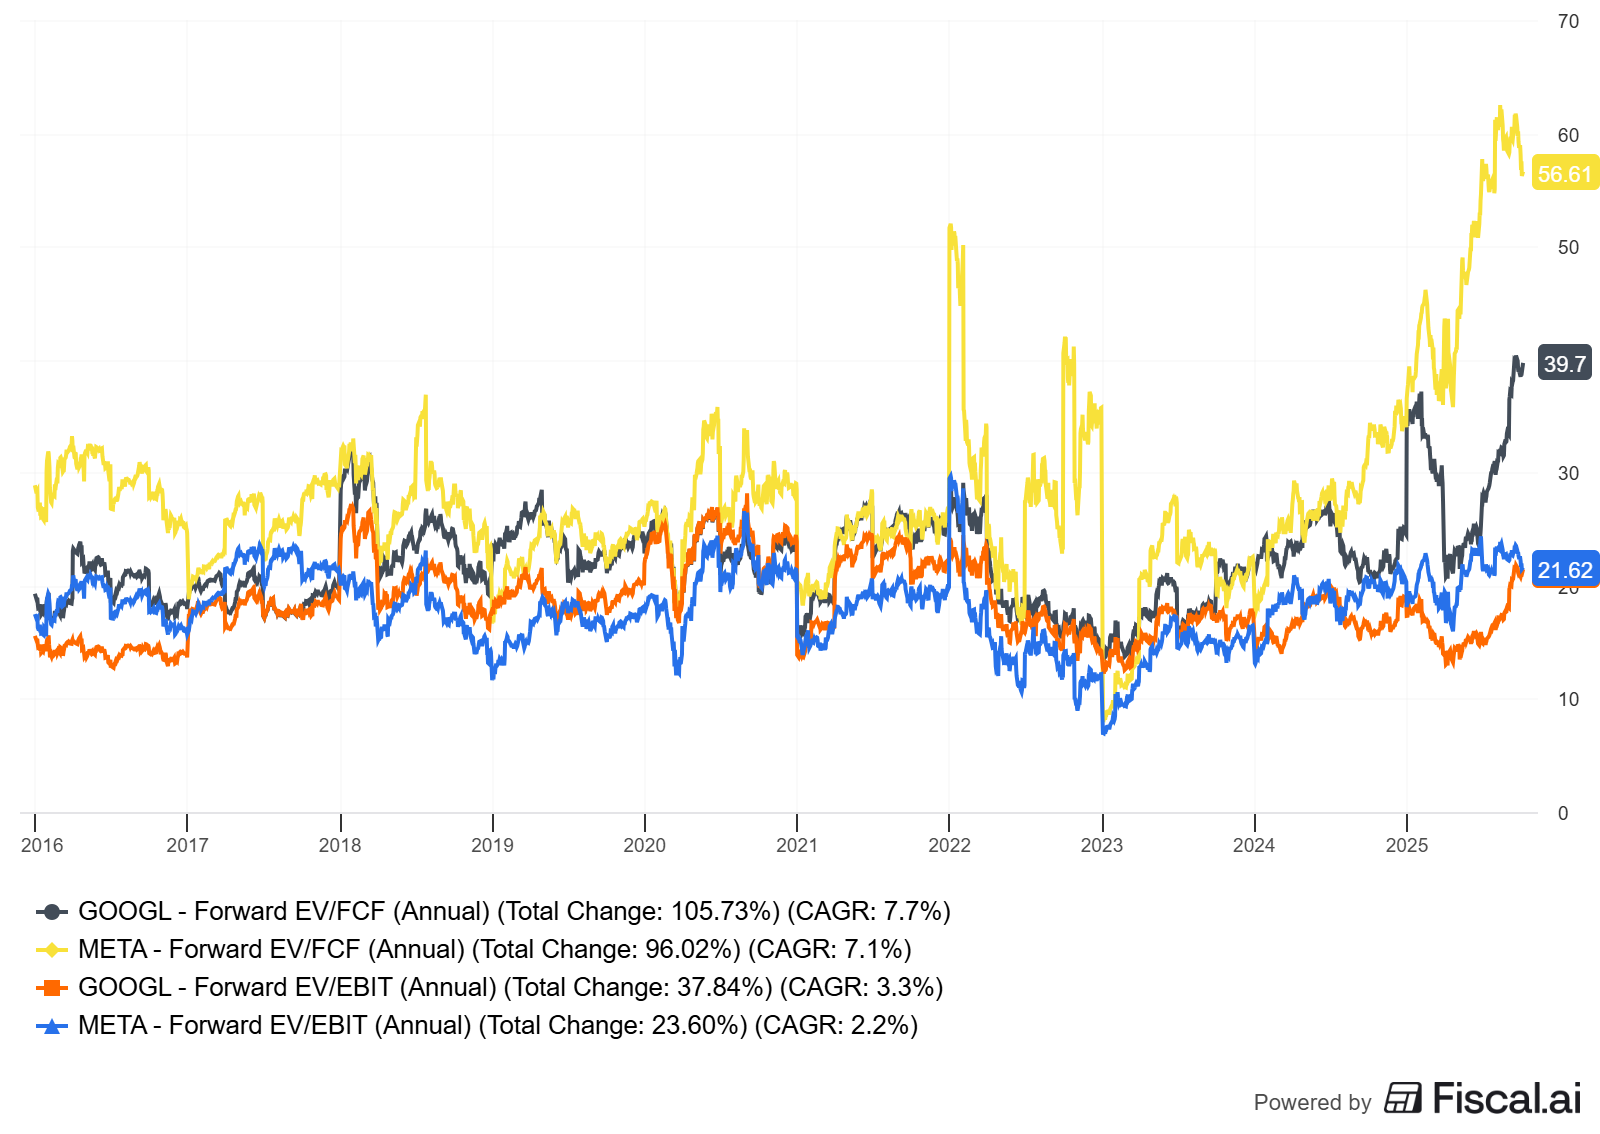
Interpretation through EV/EBIT vs. EV/FCF:
Both companies show robust EBIT and margins. EV/EBIT likely looks reasonable against history given operating leverage, efficiency, and mix.
EV/FCF looks “richer” because FCF is temporarily suppressed by capex (servers, data centers, networking). The gap between EV/EBIT and EV/FCF is the cash cost of building the next S-curve.
Quality lens questions:
Is this capex maintenance or growth?
What are the signals that these investments monetize (pricing power, engagement, Cloud backlog, ad conversion lift, new products like glasses or agents)?
Are the moats getting wider (switching costs, ecosystem lock-in)?
Mid-cycle FCF conversion: where does FCF normalize once capex decelerates?
Capital allocation and per-share framing:
Alphabet: material share repurchases and initiated dividends in 2024 ($7.4B dividends in 2024 per FY release; dividends of $2.4B in Q4 alone). SBC was ~$22.8B in 2024; diluted share count drifted lower (12,447M in 2024 vs 12,722M in 2023) Alphabet FY2024 release, as of Feb 4, 2025.
Meta: $29.8B 2024 buybacks; recurring dividend program; Q2’25 buybacks ~$9.8B. High capex spend planned; depreciation schedule extensions may reduce near-term D&A growth, but cash capex is the binding constraint Meta FY2024 and Q2’25 releases, as of Jan 29 and Jul 30, 2025.
Moat durability evidence:
Alphabet: resilient Search and YouTube ads; Cloud profitability improvement; AI Overviews and new features drive engagement and monetization. Operating margins back to low-30s [Alphabet Q4’24/Q2’25 releases].
Meta: strong ad system improvements from AI, engagement tailwinds, WhatsApp monetization ramp, and new devices (Ray-Ban Meta Glasses). Operating margin >40% in FY2024 and 43% in Q2’25 [Meta releases].
Caveats and alternative interpretations:
Elevated capex could be overbuild if AI demand and monetization trails expectations.
Regulation (EU DMA for Meta; privacy, antitrust scrutiny for both) could impact ad pricing or product design.
Depreciation lags may flatter current EV/EBIT if future depreciation and opex ramp substantially.
Do-it-yourself: step-by-step
Gather data (filings and IR)
Income statement: revenue, EBIT, tax rate.
Cash flow: operating cash flow, capex, free cash flow; SBC; buybacks/dividends.
Balance sheet: working capital; PP&E; debt/cash; share count.
Guidance: capex range; expense growth; product monetization signals.
Sources: Alphabet FY2024 and Q2’25 releases; Meta FY2024 and Q2’25 releases (links in References).
Normalize and map EBIT → FCF
Start with NOPAT: EBIT × (1 – tax rate).
Add back D&A (from cash flow statement).
Subtract capex. Split maintenance vs growth if possible (management commentary; capex/Revenue trend).
Subtract ΔWC (working capital change).
Result = FCF to firm (pre interest) if you used pre-interest inputs; reconcile to company FCF definition for sanity.
Set mid-cycle assumptions
Capex intensity mid-cycle (capex/Revenue).
FCF conversion = FCF/Revenue or FCF/EBIT mid-cycle.
WACC range (use 8–10% for mega-cap tech as a starting range; tailor to your view).
ROIC spread target: prefer sustained ROIC – WACC > 5%.
Build scenarios (3)
Bear: higher capex intensity, slower revenue/EBIT growth, lower conversion.
Base: management guidance realized; gradual normalization of conversion.
Bull: capex productivity high; monetization beats; conversion normalizes faster.
Compare multiples to history
EV/EBIT and EV/FCF vs 5–10y medians.
Explain divergences via reinvestment timing rather than declaring “overvalued.”
Per-share lens
Compute FCF/share, EPS, diluted share count trend; estimate SBC as % of CFO; measure buyback offset vs SBC.
Decision rules and thresholds
Prefer businesses with:
ROIC – WACC ≥ 5% sustained (or a path back to that post-build).
FCF conversion normalization path within 2–3 years (visibility via product/engagement/backlog).
Capex clearly tied to defensible moat or new high-return segments.
Shareholder-friendly capital returns that don’t starve high-ROIC reinvestment.
Pitfalls and false positives
Treating all capex as maintenance: over-penalizes EV/FCF during build-outs.
Ignoring depreciation lags: today’s EBIT can overstate steady-state earnings if future depreciation soars.
Overfitting to one quarter: capex is lumpy; normalize over multi-year windows.
Not checking SBC economics: high SBC with weak buyback discipline dilutes per-share gains.
Confusing narrative with evidence: demand must show up in pricing, retention, conversion, and margins.
Checklist / one-pager
ROIC – WACC spread: current and mid-cycle target.
Capex intensity path: peak → mid-cycle timeline.
FCF conversion path: trough → normalized.
EV/EBIT vs EV/FCF relative to 5–10y medians: explain divergence.
Per-share: FCF/share, EPS, diluted share count, SBC %, buybacks/dividends.
Moat evidence: margin stability, pricing power, engagement/retention, switching costs.
Regulatory headwinds: what’s priced vs. what isn’t.
Scenario outcomes: base, bear, bull with explicit conversion assumptions.
Mini-FAQ
Which multiple is “better,” EV/EBIT or EV/FCF?
Both. EV/EBIT isolates operating economics; EV/FCF prices reinvestment timing. In capex waves, use both plus a cash mapping bridge.How do I separate maintenance vs growth capex?
Use management commentary, capex/Revenue trend, and depreciation vs capex relationships. Maintenance often tracks depreciation; growth capex pushes capex >> depreciation for a period.What if ROIC dips during build-outs?
Evaluate the path back. If returns on the new capital stack will exceed WACC and drive durable cash flow, a temporary dip may be acceptable.Are buybacks always good?
Only when repurchases are below intrinsic value and not starving high-ROIC projects. Track diluted share count, SBC, and per-share FCF.How do I sanity-check a “peak capex” narrative?
Look for: product adoption, ad pricing uplift, Cloud backlog/profitability, margin durability, and evidence of capacity utilization improving over time.
Glossary
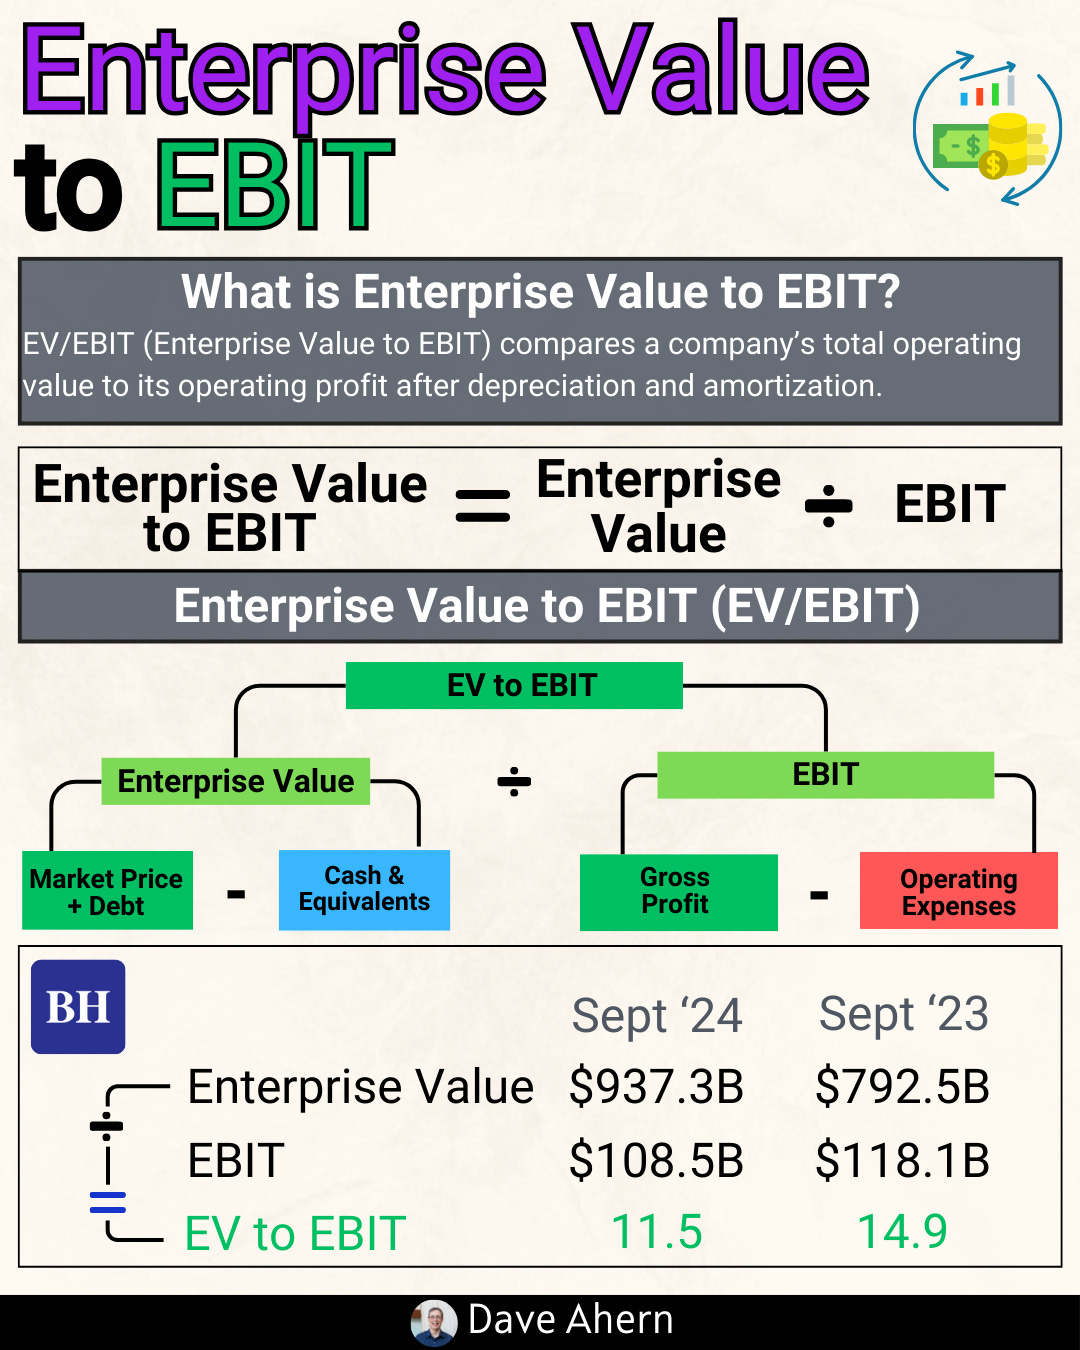
EV (Enterprise Value): Market cap + net debt (and other adjustments).
EBIT: Earnings before interest and taxes; a proxy for operating profit.
FCF (Free Cash Flow): Operating cash flow minus capex; “owner cash.”
ROIC: Return on invested capital; after-tax operating profit divided by invested capital.
WACC: Weighted average cost of capital; hurdle rate for returns.
Capex intensity: Capex as a percent of revenue.
FCF conversion: FCF as a percent of revenue or EBIT.
SBC: Stock-based compensation; a non-cash expense that dilutes owners.
Further reading
Michael Mauboussin, “Measuring the Moat” (2012) and “The Math of Value and Growth” (2016).
Aswath Damodaran, “Reinvestment, Growth and Risk” series (various posts, 2023–2024).
HBR/McKinsey pieces on ROIC and capital allocation discipline (recent years).
References
Alphabet Inc., “Fourth Quarter and Fiscal Year 2024 Results,” as of Feb 4, 2025. SEC Exhibit 99.1 and Alphabet IR PDF
Alphabet Inc., “Second Quarter 2025 Results,” as of Jul 23, 2025. SEC Exhibit 99.1
Alphabet Inc., 2024 Form 10-K (data and SBC figures), as of Dec 31, 2024. SEC filing
Meta Platforms, Inc., “Fourth Quarter and Full Year 2024 Results,” as of Jan 29, 2025. Meta IR
Meta Platforms, Inc., “Second Quarter 2025 Results,” as of Jul 30, 2025. Meta IR
Meta Platforms, Inc., “Second Quarter 2025 Results” (Capex guidance $66–72B), as of Jul 30, 2025. PR Newswire
Mode-specific: valuation frameworks, drivers, and scenario design
Framework: Mid-cycle valuation via EBIT → FCF mapping, explicitly modeling capex peaks and normalization.
Drivers: revenue growth, EBIT margin, capex intensity trajectory, working capital needs, tax rate, WACC.
Scenario design:
Bear: capex remains elevated longer; FCF conversion subdued; EV/FCF depressed vs EV/EBIT.
Base: capex normalizes in 2–3 years; conversion returns toward historical mid-cycle.
Bull: monetization of AI infra beats; conversion normalizes faster, converging EV/EBIT and EV/FCF.
How to interpret today
If EV/FCF looks stretched vs history but EV/EBIT is near median and ROIC is healthy, ask: is FCF depressed for good reasons (moat-building growth capex)?
Price catalysts: evidence of monetization (ad pricing, Cloud profitability, agent adoption), capex guidance leveling, and D&A/opex absorption without margin erosion.
Outstanding framework for navigating capex-heavy periods! The EV/EBIT vs EV/FCF divergence is exactly what trips up many investors during infrastructure build-outs. Your point about Alphabet's $85B and Meta's $66-72B capex guidance temporarily compressing FCF while maintaining strong EBIT is crucial—the market often misinterprets this as deteriorating business quality rather than recognizing it as investmnt in moat expansion. The 3-scenario cash conversion mapping is particularly useful. I'd add that for both companies, the evidence of AI monetization is already showing up: Google's Cloud profitability inflection and AI Overviews engagement metrics, plus Meta's ad system improvements from ML/AI driving better ROAS. The ROIC-WACC spread remaining healthy (despite higher invested capital denominator) validates that this isn't empire-building. Excellent work synthesizing the per-share lens with SBC dilution—that $22.8B SBC for Alphabet vs buyback pace is a critical detail most miss.