
Beyond the Numbers: Valuing Competitive Advantage Duration at Hermès and L'Oréal

Most investors know what a moat is. Fewer can accurately estimate how long it will last, and that’s where valuation errors compound.
When Hermès trades at 45x forward earnings while L’Oréal sits at 25x, despite both posting 40%+ gross margins and ROIC above 20%, the market isn’t confused. It’s pricing moat duration, the single most powerful, least-discussed variable in terminal value assumptions.
TL;DR
Moat duration drives 60-80% of DCF value through terminal assumptions, yet most models treat it as a binary (exists/doesn’t exist) rather than a fade rate.
Hermès’s 180-year brand heritage and artisanal production constraints create a self-reinforcing moat that strengthens over time, justifying 15+ year competitive advantage periods in models.
L’Oréal’s innovation-driven moat requires constant reinvestment (10% of sales into R&D/marketing), making its competitive edge more susceptible to disruption and fade.
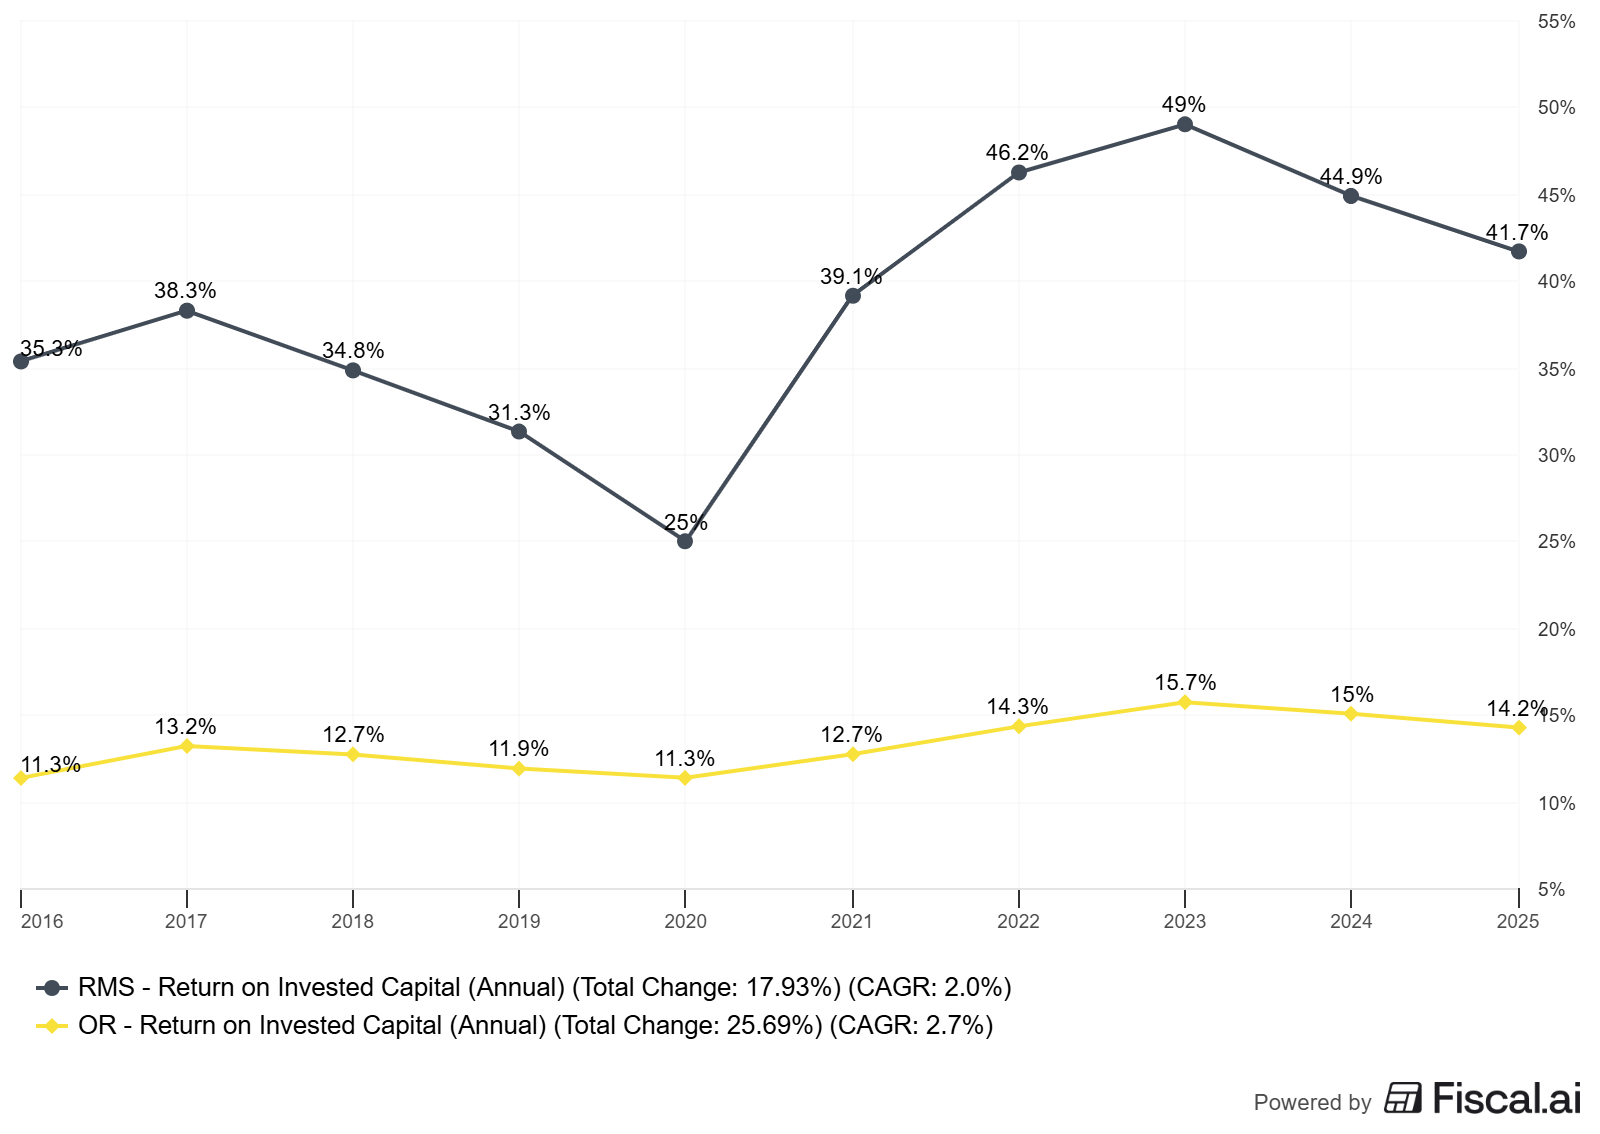
Evidence-based moat assessment: Hermès maintains 40.5% operating margins with zero marketing spend and 6% employee turnover vs. 33% industry average; L’Oréal’s 20% margin requires 5% A&P spend just to maintain position.
Practical framework: Use ROIC fade rates, reinvestment intensity, and pricing power resilience to set differentiated terminal value assumptions rather than defaulting to perpetuity growth.
Why It Matters: The 60-80% Problem
Terminal value typically represents 60-80% of a company’s intrinsic value in DCF models.
Yet most investors spend 90% of their time on the explicit forecast period (years 1-5) and treat terminal value as an afterthought, plugging in GDP growth rates or exit multiples without interrogating the competitive dynamics that drive them.
Base rates matter. Research on competitive advantage persistence shows the median Fortune 500 company maintains ROIC > WACC for just 5-7 years before mean reversion. Yet many DCF models implicitly assume perpetual excess returns by using Gordon Growth formulas with no fade adjustment.
This systematic overvaluation becomes especially dangerous in luxury and consumer brands, where heritage and innovation follow different decay curves.
Where investors go wrong: They confuse having a moat today with sustaining a moat for decades. A company posting 30% ROIC might deserve a 35x multiple if that ROIC persists for 20 years, but only 18x if it fades to cost of capital in 8 years. The difference? Moat duration—and it’s entirely predictable if you know what evidence to track.
Consider Hermès and L’Oréal, both French luxury leaders with enviable economics. As of February 2025, Hermès trades at ~45x forward earnings on €15.2 billion revenue with 40.5% operating margins. L’Oréal trades at ~25x on €43.5 billion revenue with 20% operating margins. Both generate 20%+ ROIC and growing per-share FCF. The valuation gap isn’t about current quality—it’s about how long that quality compounds.
Moat Durability: Evidence, Not Claims
Most investor decks tout “strong brands” and “loyal customers.” Quality investors demand proof.
Hermès’s evidence of moat strengthening:
Pricing power without volume trade-off: Hermès raised prices 6-7% in 2024 while growing volume 8-9%. Revenue grew 15% at constant FX. Higher prices increased desirability rather than deterring buyers.
Secondary market premium: Birkin bags start at 2x retail on resale, with rare pieces hitting 4x. When Victoria Beckham’s collection of 100+ Birkins is worth $2+ million, the asset class dynamics are clear.
Employee retention as moat proxy: Hermès’s 6% turnover vs. 33% luxury industry average signals that the artisan model creates knowledge lock-in. You can’t poach talent that took a decade to train and is embedded in a proprietary system.
Margin expansion during slowdown: In 2024, while LVMH’s Fashion & Leather division posted low-single-digit growth and Kering saw revenue fall 11%, Hermès maintained 40.5% operating margin and 15% growth. Flight-to-quality dynamics benefit the top player disproportionately.
L’Oréal’s evidence of moat maintenance:
Market share gains: L’Oréal outgrew the beauty market by ~2 points in 2024 (5.1% vs. ~3% market), extending its #1 position globally. It became the #1 luxury beauty player in North America for the first time.
Innovation pipeline: L’Oréal filed 500+ patents annually and launched products using AI-powered personalization tools (BETiq covers 45% of consumer-facing A&P, improving productivity 10-15%).
Gross margin expansion: L’Oréal’s gross margin hit an all-time high of 74.2% in 2024 (+30bps), showing scale economies and premiumization working.
Category rotation: Fragrances grew 14.1%, haircare 12.7%. L’Oréal can shift capital across 37 global brands to ride trends, reducing single-category risk.
The durability contrast: Hermès’s moat evidence shows self-reinforcing advantages—higher prices → more desirability → more pricing power. L’Oréal’s evidence shows successful defense—constant innovation and A&P spending maintain share and margin, but stop spending and the moat weakens.
Worked Example: Hermès vs. L’Oréal (2015-2024 Trends)
Let’s examine a decade of financials to assess moat trajectory, using “as of February 2025” data.
Hermès: The Compounding Heritage Moat
Revenue and margin trends (2015-2024):
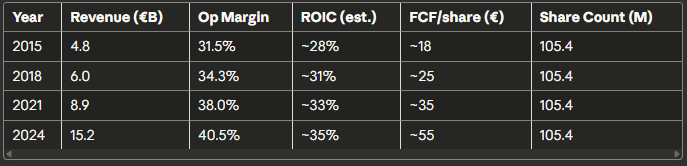
Key observations:
Margin expansion through cycle: Hermès grew margins 900bps over nine years—unheard of for a company already operating at 30%+ margins in 2015. This signals increasing pricing power and operating leverage, not one-time restructuring.
Zero dilution: Every euro of profit growth flowed to existing shareholders. Combined with modest dividends and virtually no debt, Hermès’s per-share compounding is pristine.
Resilience in downturn: In H1 2024, when luxury peers saw double-digit profit declines, Hermès grew revenue 12% and held margin at 42%. In Q4 2024, amid China weakness, Hermès posted 18% growth. The ultra-wealthy constituency is cyclically insulated.
Moat duration assessment: Hermès’s evidence suggests a moat that strengthens with time. Brand heritage compounds (can’t be replicated in <180 years), artisan scarcity intensifies (limited talent pool), and pricing power increases (secondary market dynamics prove willingness to pay). Conservative estimate: 15-20 year competitive advantage period before any meaningful ROIC fade.
L’Oréal: The Innovation-Driven Moat
Revenue and margin trends (2015-2024):
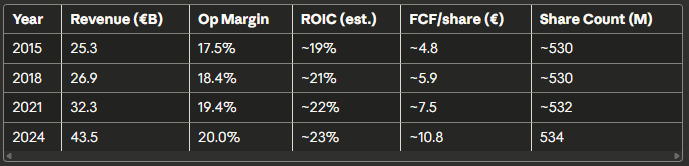
CAGR 2015-2024: Revenue +6.1%, Operating profit +9.1%, FCF/share +9.4%.
Key observations:
Gradual margin expansion: L’Oréal improved margins 250bps over nine years—solid execution, but required intense A&P and R&D investment to defend share in a competitive market.
Modest dilution: Share count grew marginally from M&A (Aesop, Medik8, Color Wow) but was largely offset by buybacks, clean per-share growth.
Regional diversification: L’Oréal’s multipolar model (Europe, North America, Asia, Emerging Markets) provides growth optionality. When China weakened in 2024, North America and Europe compensated.
Moat duration assessment: L’Oréal’s moat is real but maintenance-intensive; innovation cycles in beauty run 18-36 months. A breakthrough product (e.g., Elvive haircare, Duo Serum anti-aging) can drive years of growth, but requires continuous R&D replenishment.
Brand strength is high, but not impervious—new entrants like Fenty Beauty or K-beauty brands can gain share quickly with viral marketing. Conservative estimate: 8-12 years competitive advantage period before ROIC begins a gradual fade toward the cost of capital.
Alternative interpretation: Bulls might argue L’Oréal’s 37 global brands and portfolio rotation capability extend the moat to 15+ years.
Fair point.
But that assumes flawless capital allocation across brands; Aesop (acquired Aug 2023) needs to prove out, and not every brand in the portfolio generates excess returns. I prefer the conservative view until more evidence accumulates.
Valuation Implications: Running the DCF
Let’s build two simplified DCF models to show how moat duration assumptions drive valuation gaps.
Hermès DCF (15-year competitive advantage period):
Assumptions:
Explicit forecast (Years 1-5): Revenue growth 10-12% (slower than historical due to artisan constraints), margins hold at 40%+, capex 6% of sales.
Fade period (Years 6-15): Revenue growth declines linearly from 10% to 4% (GDP+1%), ROIC fades from 35% to 10% (close to WACC).
Terminal value: Perpetuity at 3% growth, 10% ROIC (slight premium to WACC due to brand residual value).
WACC: 8%.
Sensitivity table: Terminal Value contribution
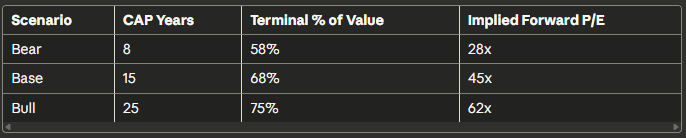
Current valuation (~45x forward P/E) implies the market prices a 15-year competitive advantage period. Given Hermès’s moat evidence, this seems fair to slightly conservative.
L’Oréal DCF (10-year competitive advantage period):
Assumptions:
Explicit forecast (Years 1-5): Revenue growth 6-8% (mid-single digits plus M&A), margins expand 20bps/year to 21%, capex 4% of sales.
Fade period (Years 6-10): Revenue growth declines from 7% to 4%, ROIC fades from 23% to 11% (closer to WACC due to innovation obsolescence risk).
Terminal value: Perpetuity at 3% growth, 11% ROIC (modest premium).
WACC: 8%.
Sensitivity table: Terminal Value contribution
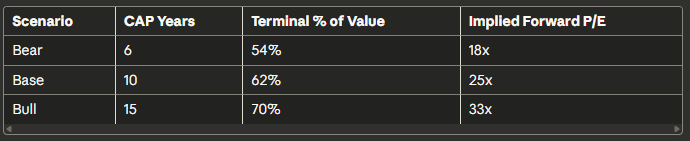
Current valuation (~25x forward P/E) implies the market prices a 10-year competitive advantage period. Given L’Oréal’s innovation requirements and competitive intensity, this seems fair to slightly optimistic unless portfolio rotation proves more durable than expected.
The 45x vs. 25x multiple explained: Hermès’s self-reinforcing moat justifies 50% more terminal value contribution than L’Oréal’s maintenance-intensive moat, even though both are quality businesses with strong current economics.
How to Do This Yourself: A Step-by-Step Framework
Step 1: Gather Historical Data (10 years minimum)
Sources:
Company filings: 10-K/20-F for US-listed, annual reports for international. Focus on segmented revenue, operating margins by division, capex, working capital trends.
Capital IQ or Bloomberg: For historical ROIC, WACC estimates, and peer benchmarks.
Company presentations: Investor days often reveal strategic priorities and reinvestment plans.
Industry reports: Bain (luxury), Euromonitor (beauty) for category growth and competitive dynamics.
Metrics to track:
Revenue CAGR, margin trajectory (gross, operating, net), ROIC vs. WACC spread over time.
FCF conversion (FCF / Net Income), FCF per share growth, share count changes.
Pricing power proxies: ASP growth, volume vs. price/mix contribution, customer retention.
Reinvestment intensity: R&D % of sales, A&P % of sales, capex % of sales, working capital as % of revenue.
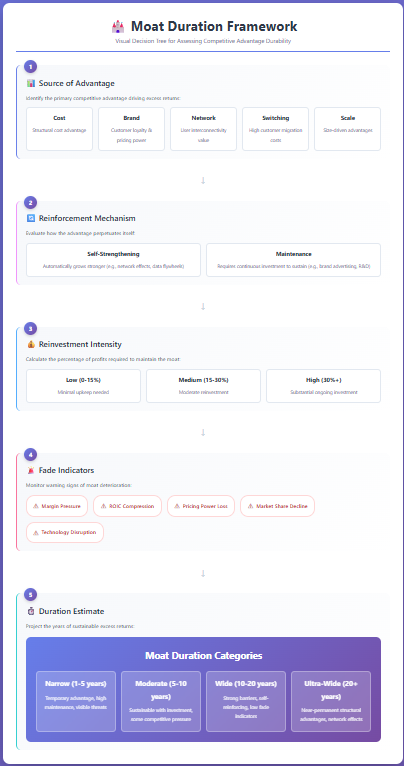
Step 2: Assess Moat Source and Durability Evidence
Framework questions:
Source of advantage: Cost (scale, scope, unique assets)? Brand (pricing power, loyalty)? Network effects (user-to-user value)? Switching costs (integration, learning curve)? Regulations (licenses, IP)?
Reinforcement mechanism: Does using the product strengthen the moat (data flywheel, habit formation, brand prestige)? Or does it deplete (fashion trends, commoditization risk)?
Reinvestment intensity: How much of profit must be reinvested to maintain the moat? High (>30% of EBIT) signals vulnerability. Low (<15%) signals durability.
Fade indicators: Watch for margin compression despite revenue growth, ROIC decline even as sales rise, loss of pricing power (volume necessary to hit targets), increased competitive intensity (new entrants, promotional activity).
Hermès example:
Source: Brand prestige + artisan scarcity.
Reinforcement: Using the product (buying a Birkin) increases desirability for others (social proof, waitlist dynamics). Self-reinforcing.
Reinvestment: ~5% of sales (low). Mostly artisan training and selective retail expansion.
Fade indicators: None evident. Margins expanding, ROIC rising, pricing power intact through downcycle.
L’Oréal example:
Source: Brand portfolio + scale economies + innovation pipeline.
Reinforcement: Mixed. Scale provides cost advantages (purchasing, manufacturing), but consumer preference is hit-driven. Success reinforces brand strength, but requires continuous innovation to avoid decay.
Reinvestment: ~35% of sales (high). R&D, A&P, portfolio M&A to stay ahead of trends.
Fade indicators: Modest. Margins expanding slowly, ROIC stable but not rising. Requires active management to sustain.
Step 3: Estimate Competitive Advantage Period (CAP)
Use historical persistence data as a starting point. According to research by Michael Mauboussin and Dan Callahan at Credit Suisse, the median large-cap company sustains ROIC > WACC for about 7 years before reversion. Top quartile companies (wide moat) sustain for 15+ years.
Decision rules:
Self-reinforcing moat with rising ROIC: 15-25 year CAP (Hermès, luxury leaders, dominant platforms).
Stable moat with consistent ROIC and low reinvestment: 10-15 year CAP (Estée Lauder, Nike, established consumer brands).
Maintenance-intensive moat with stable but not rising ROIC: 8-12 year CAP (L’Oréal, P&G, diversified portfolios).
Innovation-dependent moat with ROIC pressure: 5-8 year CAP (tech hardware, fashion retailers, cyclical industrials).
No moat, ROIC near WACC: 0-3 year CAP (commodities, competitive retail, undifferentiated services).
Step 4: Build Your DCF with Explicit Fade Assumptions
Rather than using simple Gordon Growth (assumes constant ROIC forever), model ROIC fade explicitly:
Year 1-5 (Explicit Forecast): Use detailed P&L assumptions based on management guidance and historical trends.
Year 6-CAP (Fade Period): Model linear or exponential ROIC decline from current level to WACC + 1-2%. Adjust revenue growth to reflect maturity (decline toward GDP+1%).
Post-CAP (Terminal Period): Perpetuity growth at GDP rate (2-3%), ROIC at or slightly above WACC.
Fade rate formula: If current ROIC is 30%, WACC is 8%, and CAP is 15 years, fade rate f = (30% - 10%) / 15 = 1.33% per year. Each year, ROIC declines 1.33 points until reaching steady state at 10%.
Step 5: Sensitivity Analysis and Scenario Testing
Run three scenarios:
Bear case: Shorten CAP by 5 years, assume faster fade, use lower terminal growth (2%).
Base case: Your best estimate of CAP based on moat evidence, moderate fade, GDP terminal growth (3%).
Bull case: Extend CAP by 5 years, assume slower fade due to reinforcing dynamics, higher terminal growth if TAM expansion likely (3.5%).
Tornado chart: Show which variables drive the biggest valuation swings. Typically, CAP duration and terminal ROIC spread have the largest impact—often 2-3x more influential than near-term revenue growth assumptions.
Step 6: Cross-Check with Market Multiples
Use a reverse DCF to see what moat duration the current stock price implies. If the market prices a 15-year CAP but your analysis suggests 8-10 years, the stock is overvalued even if quality is high today.
Reverse DCF process:
Take current EV (market cap + net debt).
Subtract PV of explicit forecast FCF (years 1-5).
Remaining value = implied terminal value.
Back into implied terminal FCF or ROIC assumptions.
Compare to your moat assessment. If market assumes perpetual 25% ROIC but you see fade to 12% by year 10, there’s a gap.
Checklist: One-Page Moat Duration Assessment
Use this framework for any company:
ROIC trend (10 years): Rising = strengthening moat. Stable = maintaining moat. Declining = eroding moat.
ROIC spread vs. WACC: >10pts = exceptional. 5-10pts = strong. <5pts = vulnerable.
Reinvestment intensity: <15% of EBIT to maintain position = durable. >30% = high-maintenance moat.
Pricing power evidence: Ability to raise prices without volume loss. Track ASP growth vs. volume contribution over 5+ years.
Competitive position stability: Market share trend, new entrant threat, customer switching behavior.
Moat duration estimate:
All five green flags → 15-25 year CAP
3-4 green flags → 10-15 year CAP
2 green flags → 8-10 year CAP
<2 green flags → 5-7 year CAP or no moat
Further Reading
Expectations Investing by Michael Mauboussin and Alfred Rappaport — The definitive guide to reverse DCF analysis and competitive advantage period estimation. (Published 2001, updated concepts remain relevant as of 2024)
Competitive Advantage Period (CAP) Study by Credit Suisse — Empirical analysis of how long companies sustain excess returns. Median CAP: 7 years for large caps as of 2015 study.
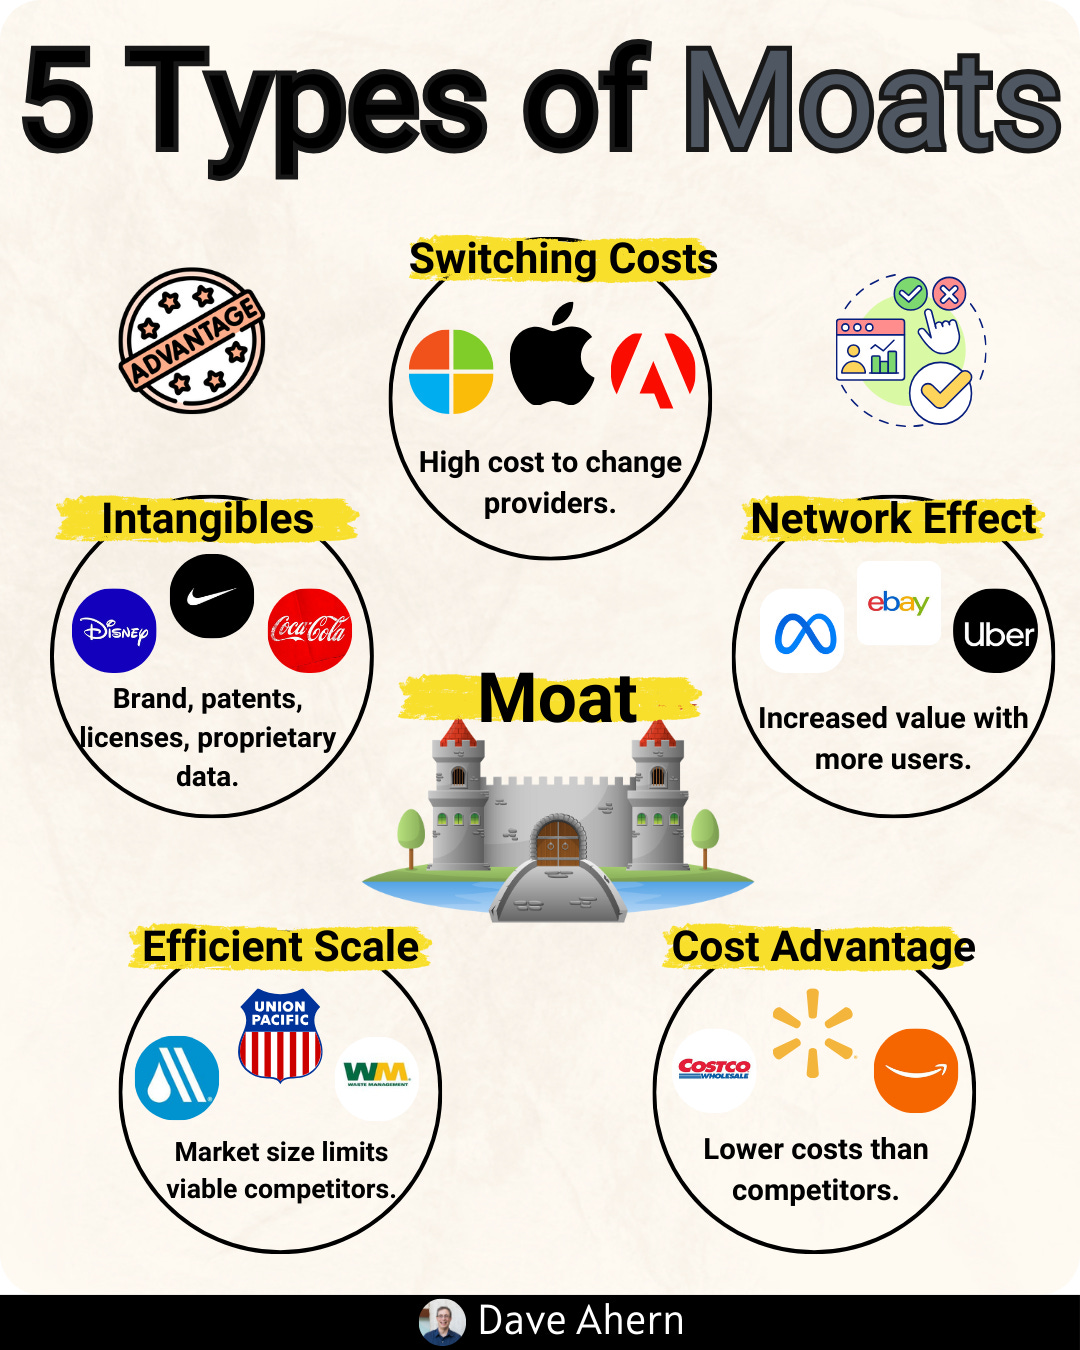
The Little Book That Builds Wealth by Pat Dorsey — Former Morningstar Equity Research Director’s framework for identifying economic moats. Covers the five sources of moat (switching costs, network effects, cost advantages, intangibles, efficient scale).
Jensen Quality Growth Insights: DCF vs. Multiples — Portfolio manager Eric Schoenstein’s discussion of how to incorporate competitive advantage duration into DCF models. (As of 2013, remains instructive)
Hermès Annual Reports 2015-2024 — Primary source financial data. Pay special attention to Notes on inventory management, artisan workshop expansion, and family shareholder agreements.
L’Oréal Universal Registration Documents 2015-2024 — Detailed segment reporting, R&D disclosures, and A&P spending trends by division.
Disclaimer
This article is for educational purposes only and does not constitute investment advice. All financial data is sourced from public filings and third-party research as cited. Readers should conduct their own due diligence and consult with qualified financial advisors before making investment decisions. Past performance does not guarantee future results.
Thanks for writing this, it clarifies a lot, really makes you think about how human perception of 'timelessness' impacts these models even more than the raw data.
excellent analysis and takeaways. love the comparisons against L and Hermes, too!