
Beyond “Payment Rails”: ROIC, Runway, and EV/FCF for V and MA

Visa and Mastercard look expensive on headline multiples. They also produce cash like few businesses on Earth. Today, we reconcile those two truths with an investor’s toolkit you can reuse across high-ROIC compounders.
We’ll frame EV/FCF correctly, tie it to ROIC and reinvestment, and pressure-test valuation with three scenarios and a sensitivity analysis.
Case: Visa vs. Mastercard.
TL;DR
For high-ROIC networks, EV/FCF is a shorthand for a multi-stage DCF. The “why” behind the multiple matters more than the number.
Value creation requires sustained ROIC > WACC plus a runway to put capital to work. Payment networks clear both, but the runway shape differs by cross-border, new flows, and incentives.
Per-share is the right unit. FCF/share growth and disciplined buybacks drive returns more than headline growth.
Decision rules: favor sustained ROIC – WACC > 5%, FCF conversion > 90%, and stable or rising FCF/share with net share count shrinking.
Build scenarios off drivers you can observe: nominal PCE/GDP, mix toward cross-border, take rate pressure from client incentives, operating leverage, and buyback cadence.
A simple sensitivity to WACC and terminal growth prevents overpaying for “quality.”
Why it matters
Most investors over-index on price-to-earnings ratios, underweight unit economics, and skip the bridge from quality to valuation. That’s how great businesses get mispriced in both directions: punished when growth decelerates, rewarded without scrutiny when growth is hot.
In payments, the base rates are unusual:
Very high operating margins with low capital intensity.
ROIC far above WACC because invested capital is tiny (software + networks, not heavy assets).
Strong FCF conversion (free cash flow divided by net income often > 100% due to low capex and favorable working capital).
Oligopolistic structure in card networks creates durability, especially in cross-border.
If you don’t connect these economics to what EV/FCF implies about future growth, margin, and reinvestment, it’s easy to either overpay for “quality” or walk away from compounding.
Core concepts
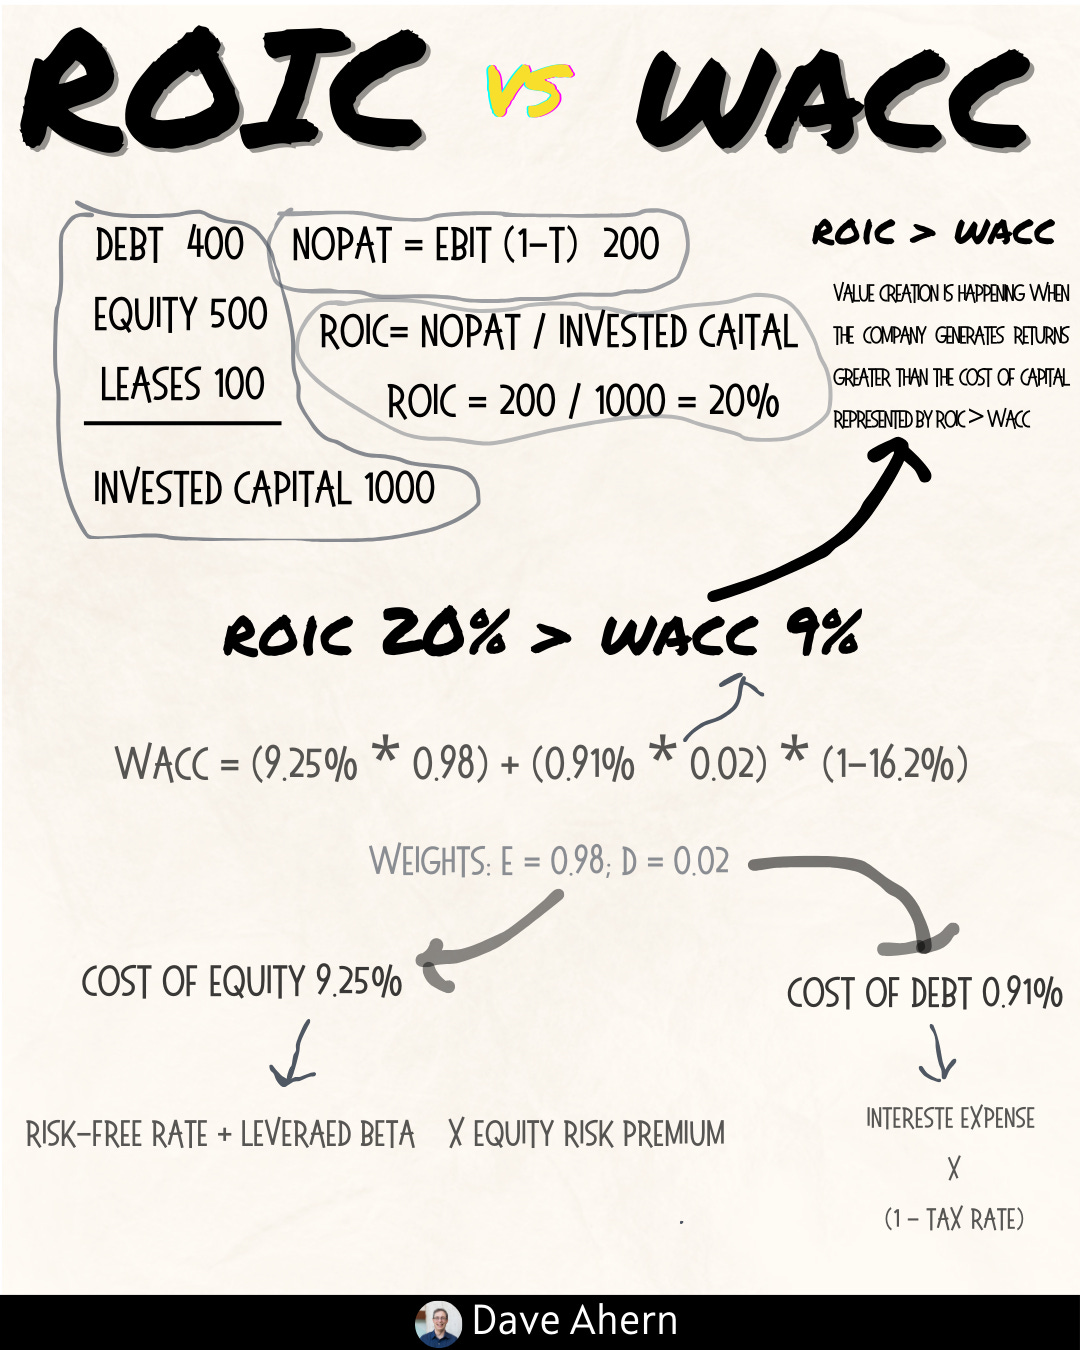
ROIC vs WACC and value creation
ROIC (return on invested capital) measures operating profit after tax relative to the capital required to run the business.
WACC (weighted average cost of capital) is the blended required return for all capital providers.
Value creation happens when ROIC > WACC. The spread times the reinvested dollars determines incremental value creation.
For networks like Visa/Mastercard, ROIC is extremely high due to a light asset base; the valuation question becomes “how much can they keep reinvesting at high returns?” rather than “can they earn their cost of capital?”
Key decision rule: Prefer companies with ROIC – WACC > 5% for many years, with evidence the spread is durable.
Reinvestment runway and capital intensity
Capital intensity: how much capital you need for each unit of incremental revenue. Card networks are low-intensity; sales and incentives spend matter more than capex.
Runway sources here:
Growth in nominal consumer and B2B spending.
Mix shift from cash to electronic payments.
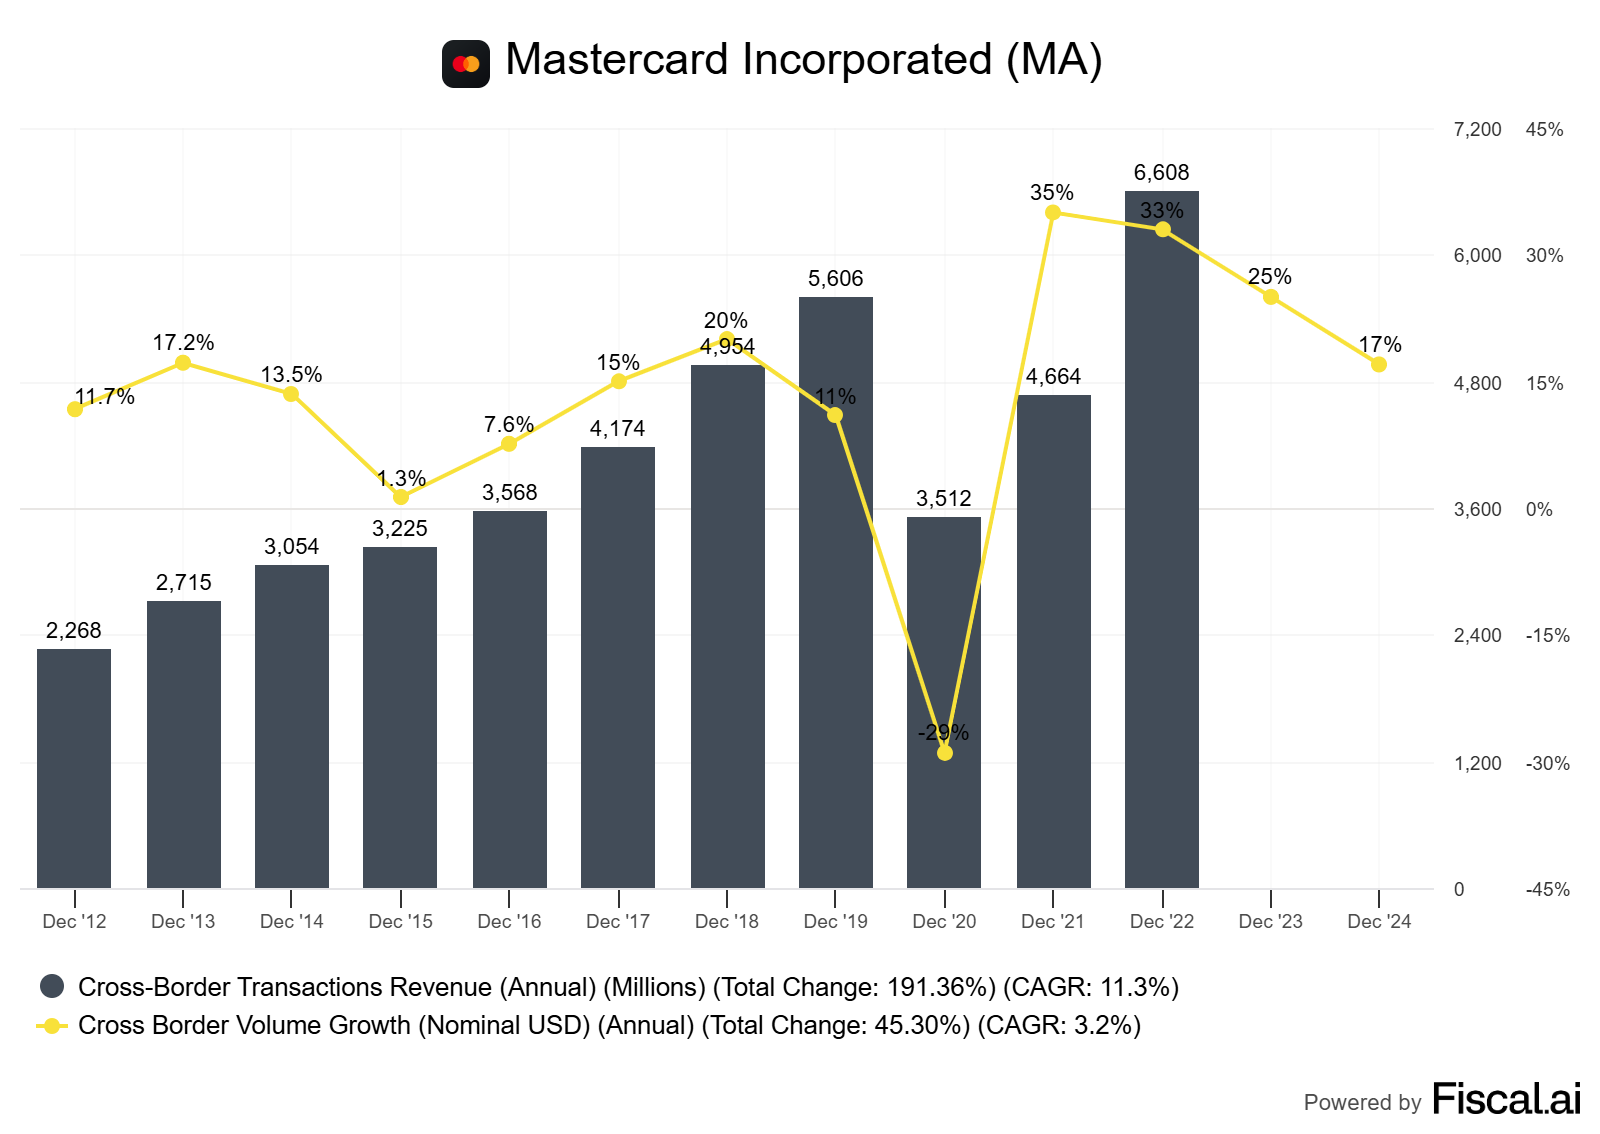
Cross-border travel and e-commerce (higher take rates).
“New flows” (bill pay, disbursements, real-time account-to-account rails) and value-added services (risk/fraud, tokenization, data).
The runway shape is broad but not limitless; take rate pressure via client incentives offsets some growth.
Unit economics and per-share metrics
Unit economics: revenue (“take rate”) per dollar of payment volume, less client incentives and operating costs. Monitor trends in incentives as a percentage of gross revenue.
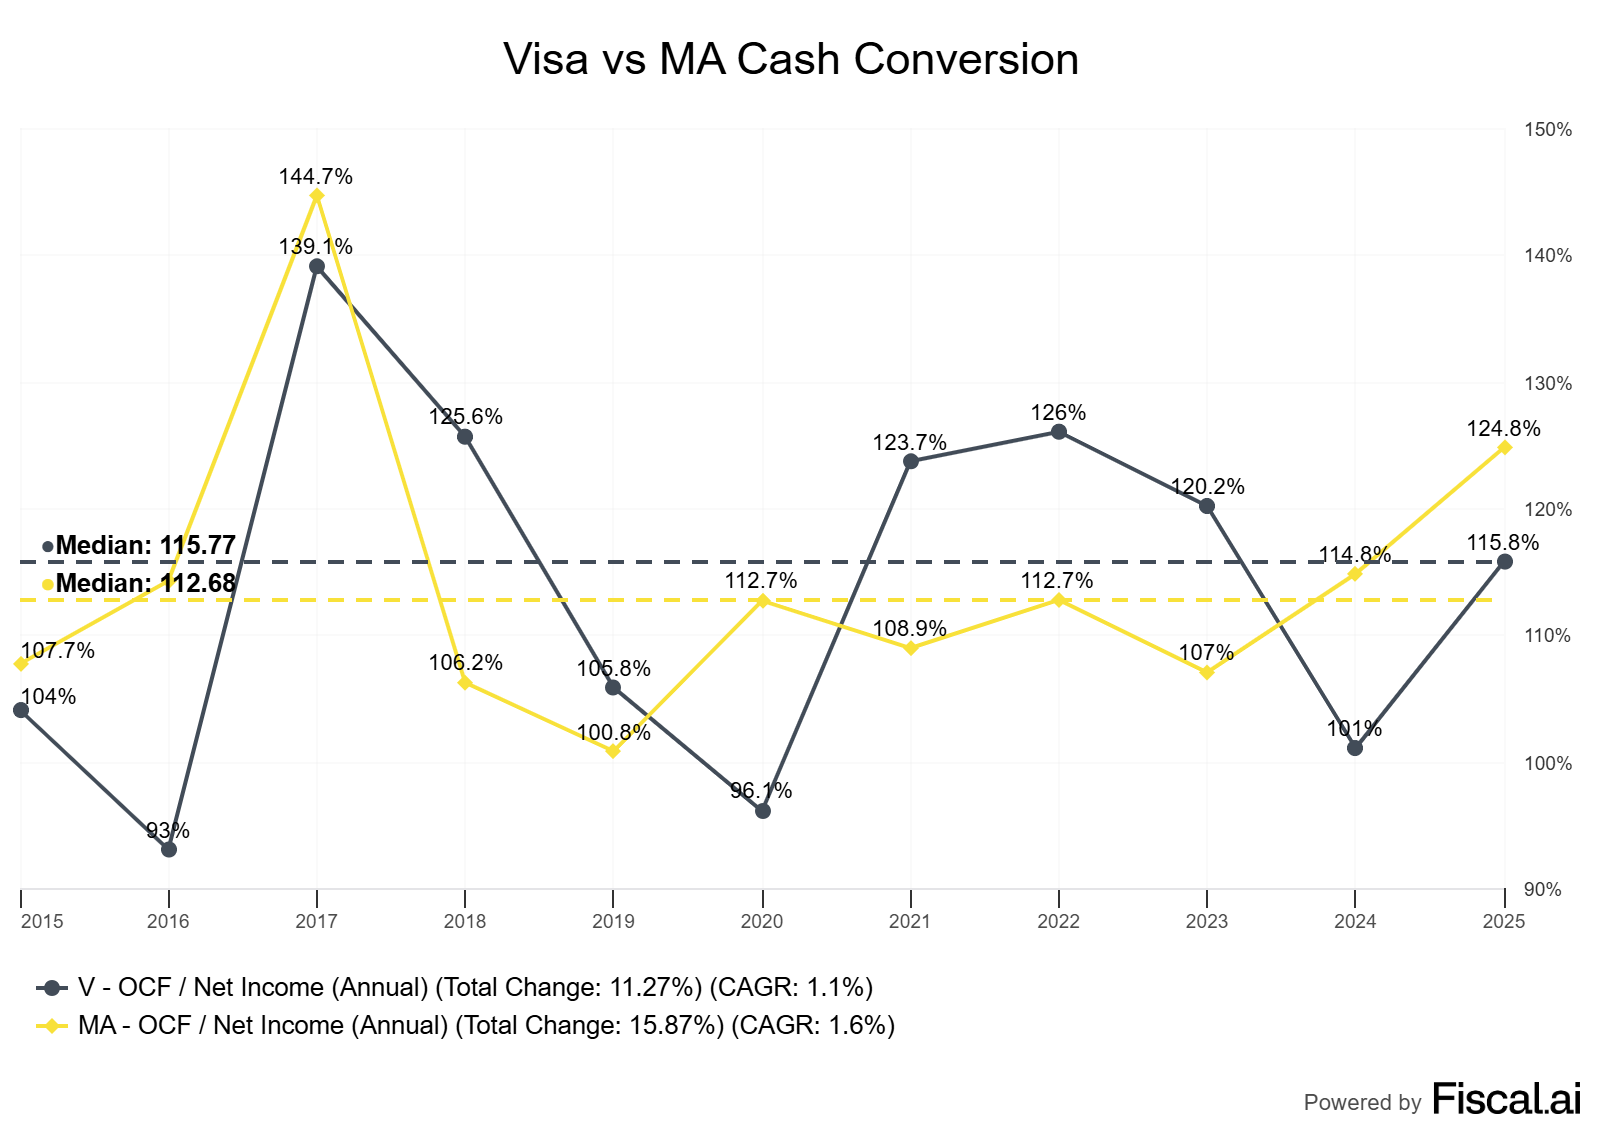
FCF conversion: FCF / Net Income and FCF margin. Because capex is low, these should be high and stable.
Per-share framing: Track FCF per share, EPS per share, and share count. Buybacks matter more than dividend optics when ROIC is high and shares aren’t expensive, but beware repurchases above intrinsic value.
Moat durability and evidence
Two-sided network effects: issuers + merchants. Scale improves acceptance, fraud tools, authorization rates.
Brand/trust and regulatory licenses across countries.
Switching costs embedded in wallets, tokenization, and merchant setups.
Evidence, not claims: stability of take rate net of incentives, margin resilience through cycles, and consistent cross-border economics.
Valuation frameworks and scenario design
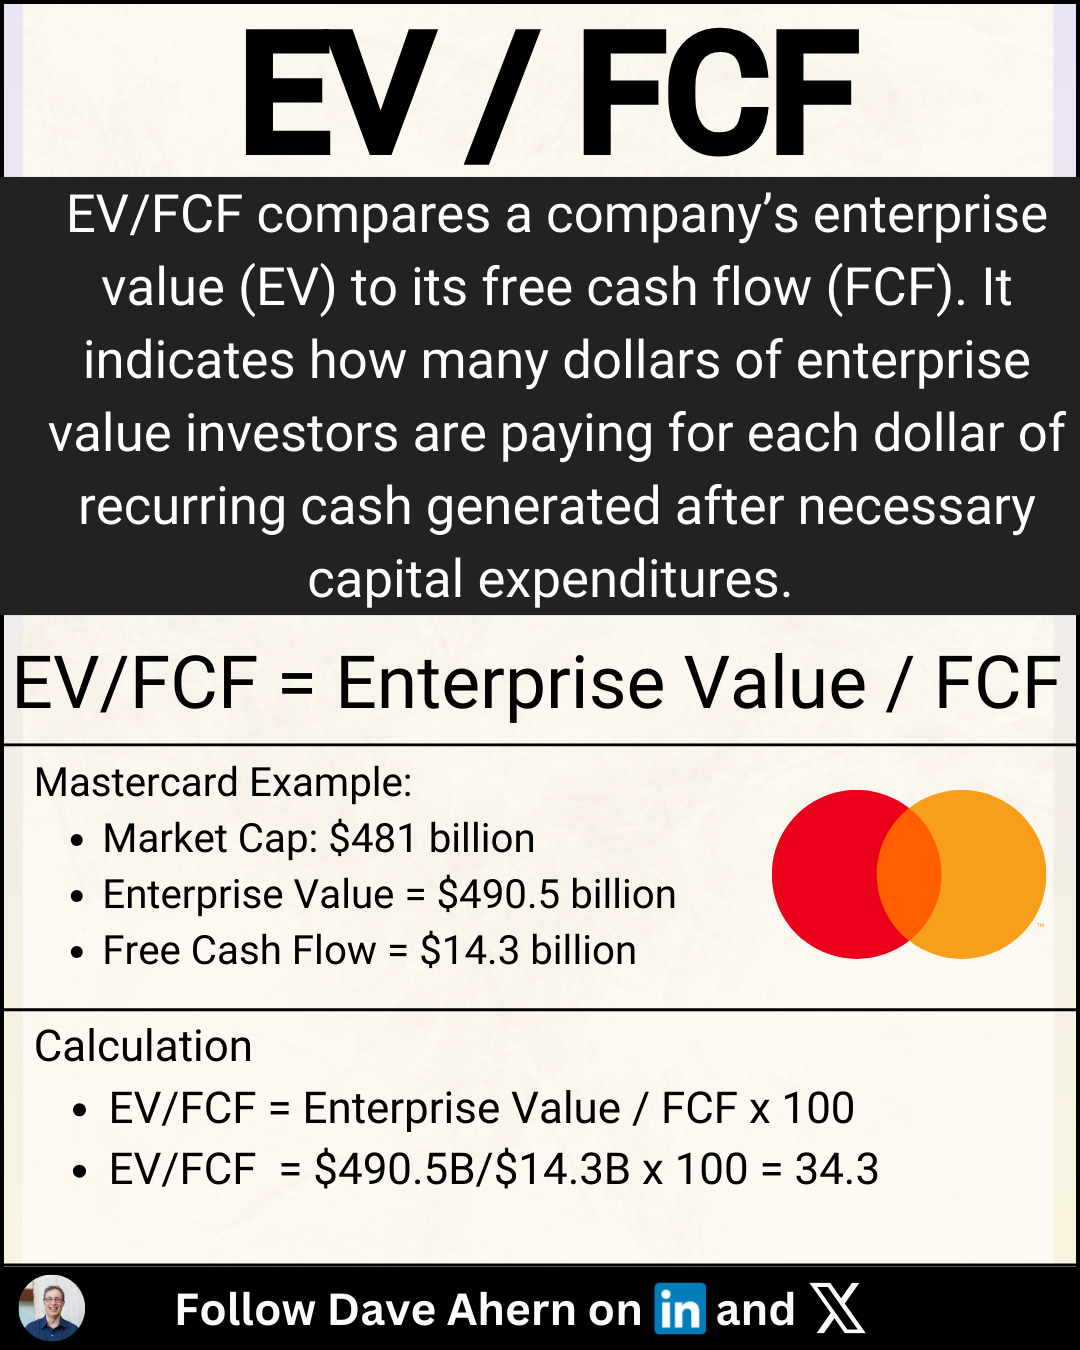
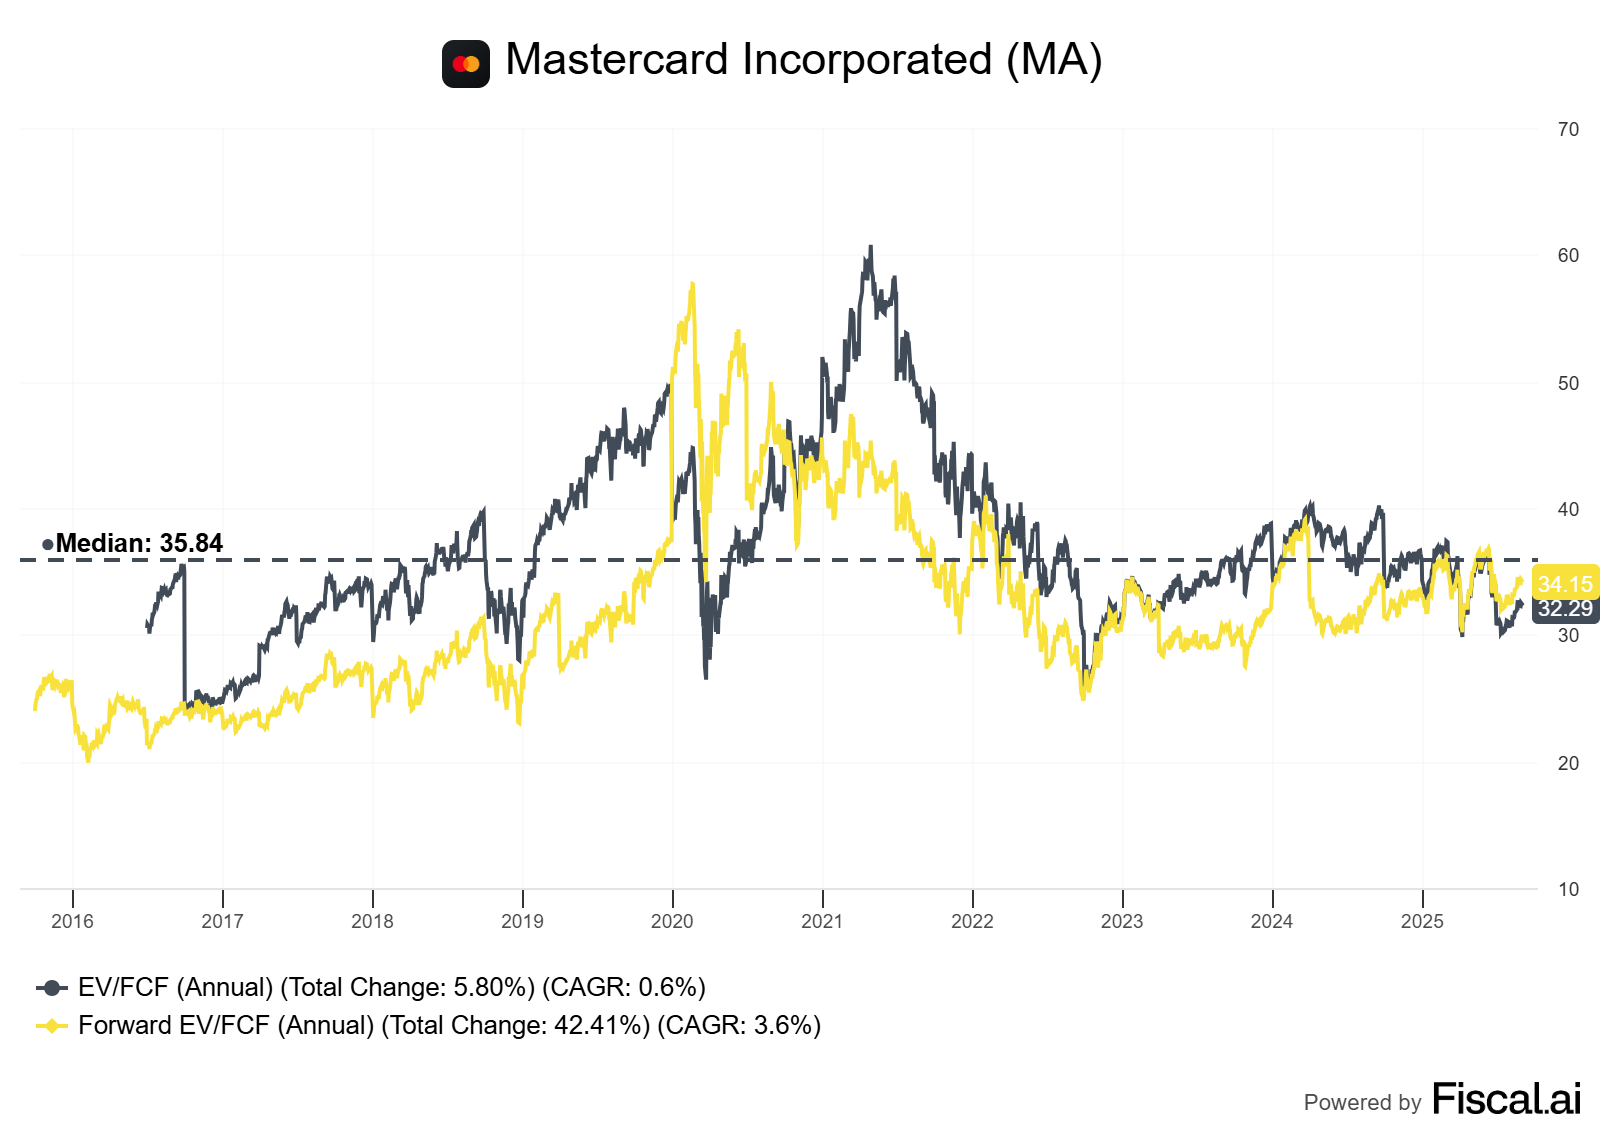
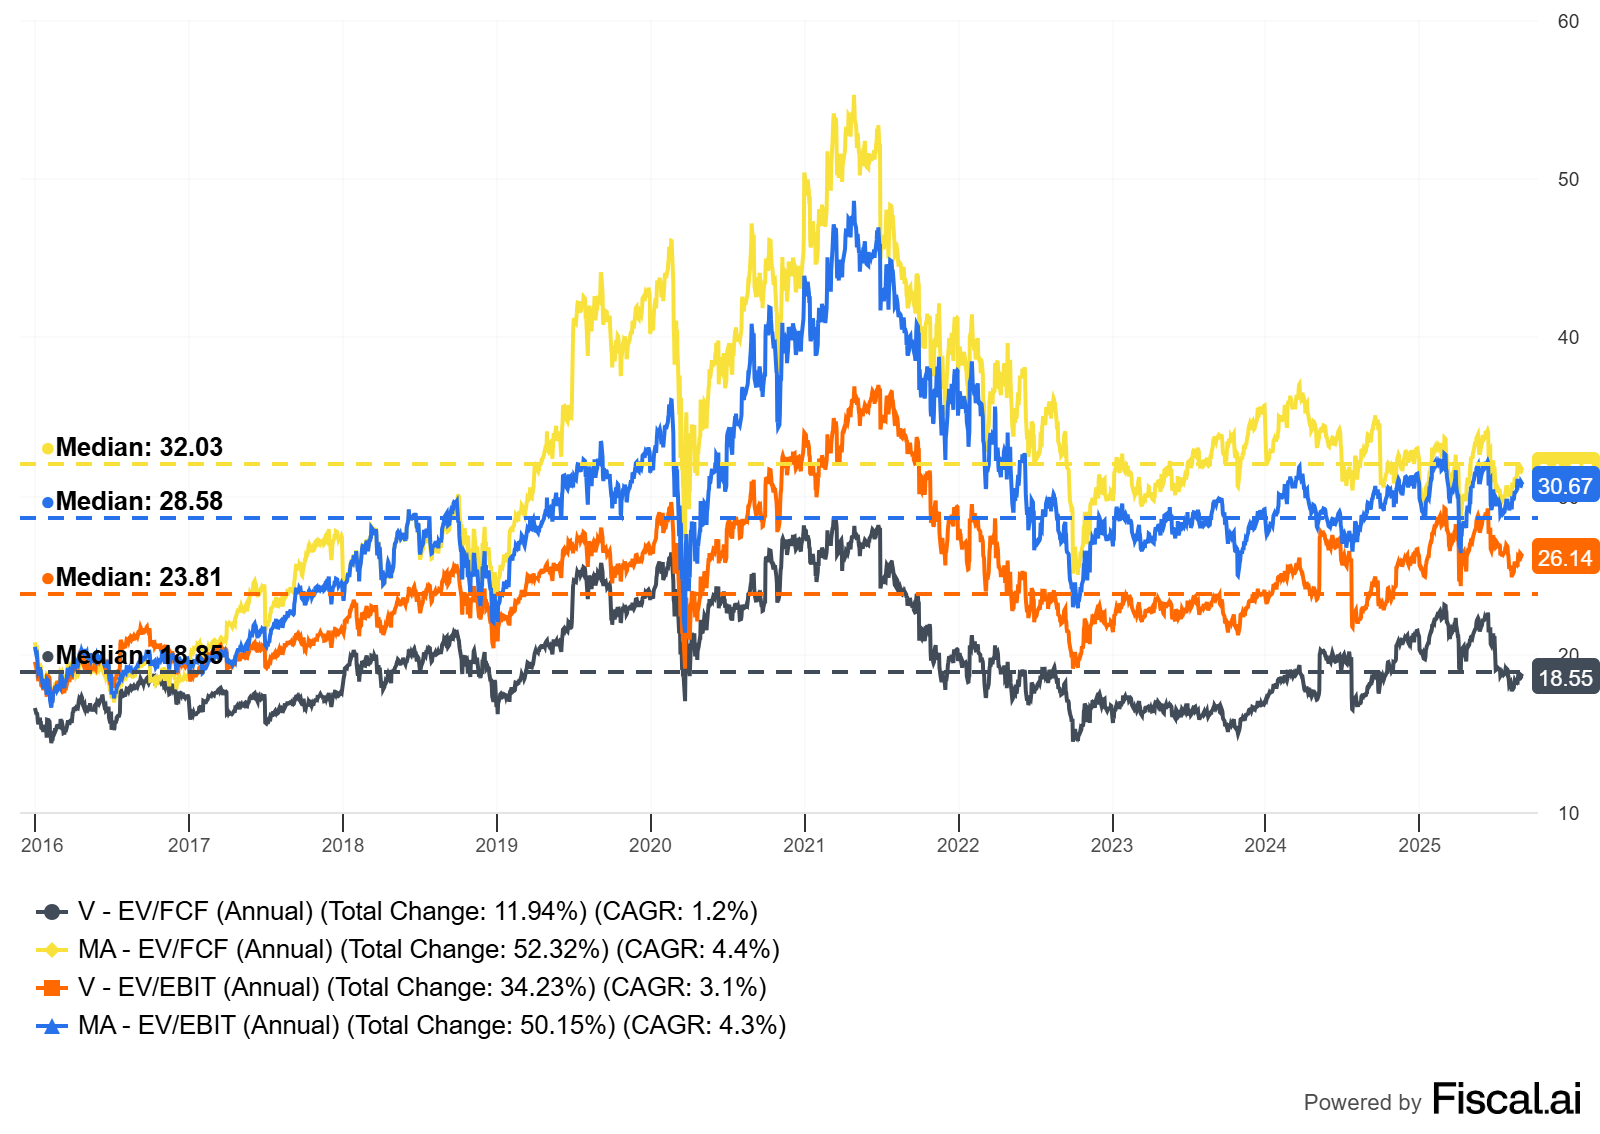
EV/FCF: Enterprise value divided by free cash flow. For high-ROIC, low-capex businesses, EV/FCF is a strong shorthand.
Justified multiple intuition (steady state): EV/FCF ≈ 1 / (WACC–g) if reinvestment needs are small and growth is funded by internally generated cash.
Multi-stage reality: Growth decelerates, mix shifts, incentives change, buybacks shrink share count. So build 3 scenarios (Downside/Base/Upside) with explicit drivers:
Nominal spending growth and cash-to-card shift.
Cross-border growth differential.
Net take rate trajectory (client incentives).
Operating leverage vs. reinvestment.
Effective tax rate.
Buyback cadence and share count path.
WACC range and terminal growth.
Worked example: Visa vs. Mastercard (US)
Scope and data notes
Focus: Visa (V) and Mastercard (MA). Both US-listed, global operations.
Period: 2015–2024 (10-year look), latest fiscal years: Visa FY2024 (Sep) and Mastercard FY2024 (Dec).
Accounting note: “Client incentives” are recorded as a contra-revenue line at both companies, which can obscure underlying take-rate dynamics. Cross-company comparisons should normalize for this.
Sources: company 10-Ks and investor materials. Please verify exact figures from filings before acting; directional conclusions hold regardless.
Visa 2024 Form 10-K Visa IR (as of FY2024).
Mastercard 2024 Form 10-K Mastercard IR (as of FY2024).
Observations (directional; verify numbers from filings)
Revenue growth (10y): Both mid-to-high single digit CAGRs with a COVID dip and a sharp cross-border recovery post-2021.
Operating margins: Typically mid-50s to high-60s. Visa often slightly higher.
FCF conversion: Frequently > 90% of net income; FCF margins large due to low capex and benign working capital.
ROIC: Extremely high using common definitions because of low invested capital; well above typical WACC bands.
Per-share: Persistent buybacks reduce share count over time; both also pay dividends.
Mix: Cross-border is a smaller share of volume but disproportionately high revenue per dollar of volume; mix shifts drive margins.
What the market is paying for (intuition)
A durable ROIC-WACC spread with moderate growth.
Continued cross-border normalization and secular electronification.
Shareholder returns via buybacks and dividends, with modest dilution from SBC.
Three-scenario EV/FCF framework (illustrative)
Mechanics: We estimate a forward FCF, apply a justified EV/FCF derived from a multi-stage outlook (near-term growth, fade period, terminal), then reconcile to per-share via net debt and shares.
Core drivers:
Near-term nominal TPV growth (Total Payment Volume) tied to PCE/GDP.
Cross-border volume growth and yield premium vs domestic.
Net take rate change (client incentives trend).
Opex leverage vs reinvestment (risk/fraud, network upgrades, new flows).
Tax rate normalization.
Share count change from buybacks (net of SBC).
Illustrative assumptions for a Base Case (not forecasts; for method only)
WACC: 8.5% (range 7.5–9.5%).
3-year FCF growth: 10–12%, fading to 6% terminal.
FCF conversion: 95–105% of NI.
Net take rate stable to slight compression; cross-border mix offsets.
Net buybacks: 1–2% annual share count reduction.
Implied justified EV/FCF ranges
Downside: 20–25x (if WACC 9.5–10% and terminal g 3–4%, plus weaker cross-border).
Base: 25–30x (WACC ~8.5%, g ~4.5–5.0%, stable incentives).
Upside: 30–35x (WACC 7.5–8.0%, g 5.5–6.0%, cross-border/mix better than expected).
Sensitivity (what moves your fair value most)
The biggest swing factors are WACC and terminal growth, followed by cross-border spread and take rate pressure.
Tornado example: A +/- 50bps move in WACC can shift justified EV/FCF by ~3–5 turns; a +/- 50bps shift in terminal growth can do similar.
Company-specific: Mastercard historically leans a bit more into cross-border and new flows/services; Visa often carries a slight margin advantage and similar discipline. This can justify a small persistent multiple differential either way, depending on the mix and execution.
Caveats and alternative interpretations
ROIC calculations vary widely in software/network businesses. If you capitalize customer incentives or treat acquired intangibles differently, ROIC will change. The qualitative conclusion (ROIC >> WACC) is robust.
Structural changes (real-time account-to-account rails, regulation, wallet intermediaries) may affect take rates and bargaining power. New flows and value-added services can offset.
FX and travel cycles make cross-border volatile; normalize over a cycle.
How to do this yourself
Data to gather (primary sources first)
10-K/20-F and latest 10-Q: income statement, cash flow, segment disclosures, client incentives, capex, SBC, share count, buyback authorizations. Visa IR | Mastercard IR
Investor presentations for strategy and mix (cross-border, new flows, value-added services).
Optional: macro series for nominal consumer spending and travel recovery.
Exact checks and calculations
ROIC vs WACC
NOPAT = Operating income × (1 – tax rate).
Invested capital = Net working capital + net PP&E + capitalized intangibles (your policy). Keep policy consistent across companies.
ROIC = NOPAT / Average invested capital.
WACC: Use your standard build (risk-free, beta, ERP, after-tax cost of debt).
FCF conversion and margin
FCF = CFO – capex. Track FCF / Net Income and FCF / Revenue.
Per-share and dilution
FCF/share, EPS/share, average diluted shares. Calculate net buybacks: repurchases – issuance (SBC, M&A).
Incentives/take rate
Track client incentives as % of gross revenue and net take rate over time.
Valuation
Forward FCF estimate (next 12 months).
Apply scenario-specific EV/FCF. Reconcile to equity value: EV – net cash/debt; divide by diluted shares.
Decision rules and thresholds
Prefer ROIC – WACC > 5% sustained over 5+ years.
FCF conversion > 90% and reasonably stable.
Cross-border exposure a net positive if volatility is acceptable and liquidity is strong.
Per-share: Net share count declining; SBC < ~3% of revenue and offset by repurchases at or below intrinsic value.
Pay no more than your Base Case fair value. Trim if the multiple implies a heroic terminal g or implausibly low WACC.
Pitfalls and false positives
Treating EV/FCF in isolation. High multiples can be fair if ROIC is high and the reinvestment runway remains long. The why matters.
Ignoring client incentives. Rising incentives can mask take-rate compression; normalize.
Overweighting headline volume. Domestic volume growth without mix or yield uplift may not move FCF as much as you think.
Underestimating regulation. Fee caps, data rules, and routing mandates can alter bargaining power; monitor these changes by region.
Buyback optics. Repurchases above intrinsic value destroy per-share value; track the average repurchase price versus your fair value.
Checklist / one-pager
ROIC – WACC > 5% (consistent definition across comps).
FCF conversion > 90%; FCF margin stable or rising.
A cross-border mix is rising or at least resilient.
Client incentives: flat/down as % of gross revenue, or offset by mix/scale.
Per-share: FCF/share and EPS/share growing; share count falling.
Capital allocation: buybacks + dividends funded by FCF, not leverage; SBC modest.
Valuation: Base Case justified EV/FCF within 10% of market; sensitivity acceptable.
Risks mapped: regulation, A2A rails, wallets/intermediaries, travel cycles.
Glossary
ROIC: Return on invested capital; NOPAT divided by invested capital.
WACC: Weighted average cost of capital; blended required return to equity and debt holders.
FCF conversion: Free cash flow divided by net income.
Client incentives: Payments to issuing banks/partners; accounted for as contra-revenue.
Take rate: Net revenue per dollar of payment volume.
Cross-border: Transactions where issuer and acquirer are in different countries; typically higher yield.
EV/FCF: Enterprise value divided by free cash flow; a valuation multiple.
SBC: Stock-based compensation; non-cash expense that can dilute shareholders.
Further reading
Aswath Damodaran, Cost of Capital and valuation primers (2024–2025 updates) NYU (as of 2025-01).
Michael Mauboussin, “The Math of Value Creation” (2020) Morgan Stanley (as of 2020-08).
BIS Committee on Payments and Market Infrastructures, “Trends in retail payments” (2023) BIS (as of 2023-12).
Visa Investor Day materials and 10-Ks Visa IR (as of FY2024).
Mastercard Investor Community Meeting and 10-Ks Mastercard IR (as of FY2024).
References
Visa Inc., Form 10-K FY2024 and prior, sections on client incentives, operating results, cash flows (as of FY2024):
https://investor.visa.com/
Mastercard Incorporated, Form 10-K FY2024 and prior, sections on rebates and incentives, operating results, cash flows (as of FY2024):
https://investor.mastercard.com/
Aswath Damodaran, data and notes on WACC and valuation (as of 2025-01): https://pages.stern.nyu.edu/~adamodar/
Michael Mauboussin, “The Math of Value Creation,” Morgan Stanley (as of 2020-08): https://www.morganstanley.com/im/en-us/institutional-investor/insights/articles/the-math-of-value-creation.html
BIS CPMI, reports on retail payments trends (as of 2023-12): https://www.bis.org/cpmi/
Disclaimer
Educational content, not investment advice.
Great article, but enterprises like MA and V shouldnt be treated as technological enterprises and count the I+D as part of the capital needed to mantein their dominance?